Absorptions and Exhaustions: The Two Most Important Order Flow Signals
Absorption and exhaustion are the two fundamental order flow signals that precede real turning points in the market. Both produce reversals, but for entirely different reasons: an absorption tells you that a large participant is actively defending a price level. An exhaustion tells you that the driving force behind a move has been spent. Confusing the two means misreading the cause, and that leads to bad decisions.
Risk Disclaimer: Trading futures and other financial instruments involves significant risk of loss. Past results are not indicative of future performance. Only trade with capital you can afford to lose.
Most traders learn dozens of setups, indicators, and patterns. But if you truly understand order flow, nearly every turning point can be traced back to one of these two mechanisms. In my own trading, these two concepts made the biggest difference. Not because they are complicated, but because they make the logic behind price movement visible.
In this article, I break down both signals in detail, show you the critical difference between them, and give you a clear method for identifying each in the footprint chart and the tape.
What Is an Absorption in Order Flow?
An absorption happens when aggressive market orders hit a price level and get soaked up by passive limit orders, without the price moving. The market sends volume in one direction, but price does not respond. That is not random. Someone is standing there with enough size on the other side, absorbing the pressure.
The Mechanism Behind Absorptions
Picture this: NQ price is dropping toward VWAP. Aggressive sellers are pushing down with market sell orders. At the VWAP level, an institutional participant has stacked massive limit buy orders. Every incoming market sell order gets matched instantly by a limit buy. Volume is high, delta is strongly negative (lots of aggressive sellers), but price does not move a single tick.
That is absorption in its purest form: high volume, high delta, zero price movement.
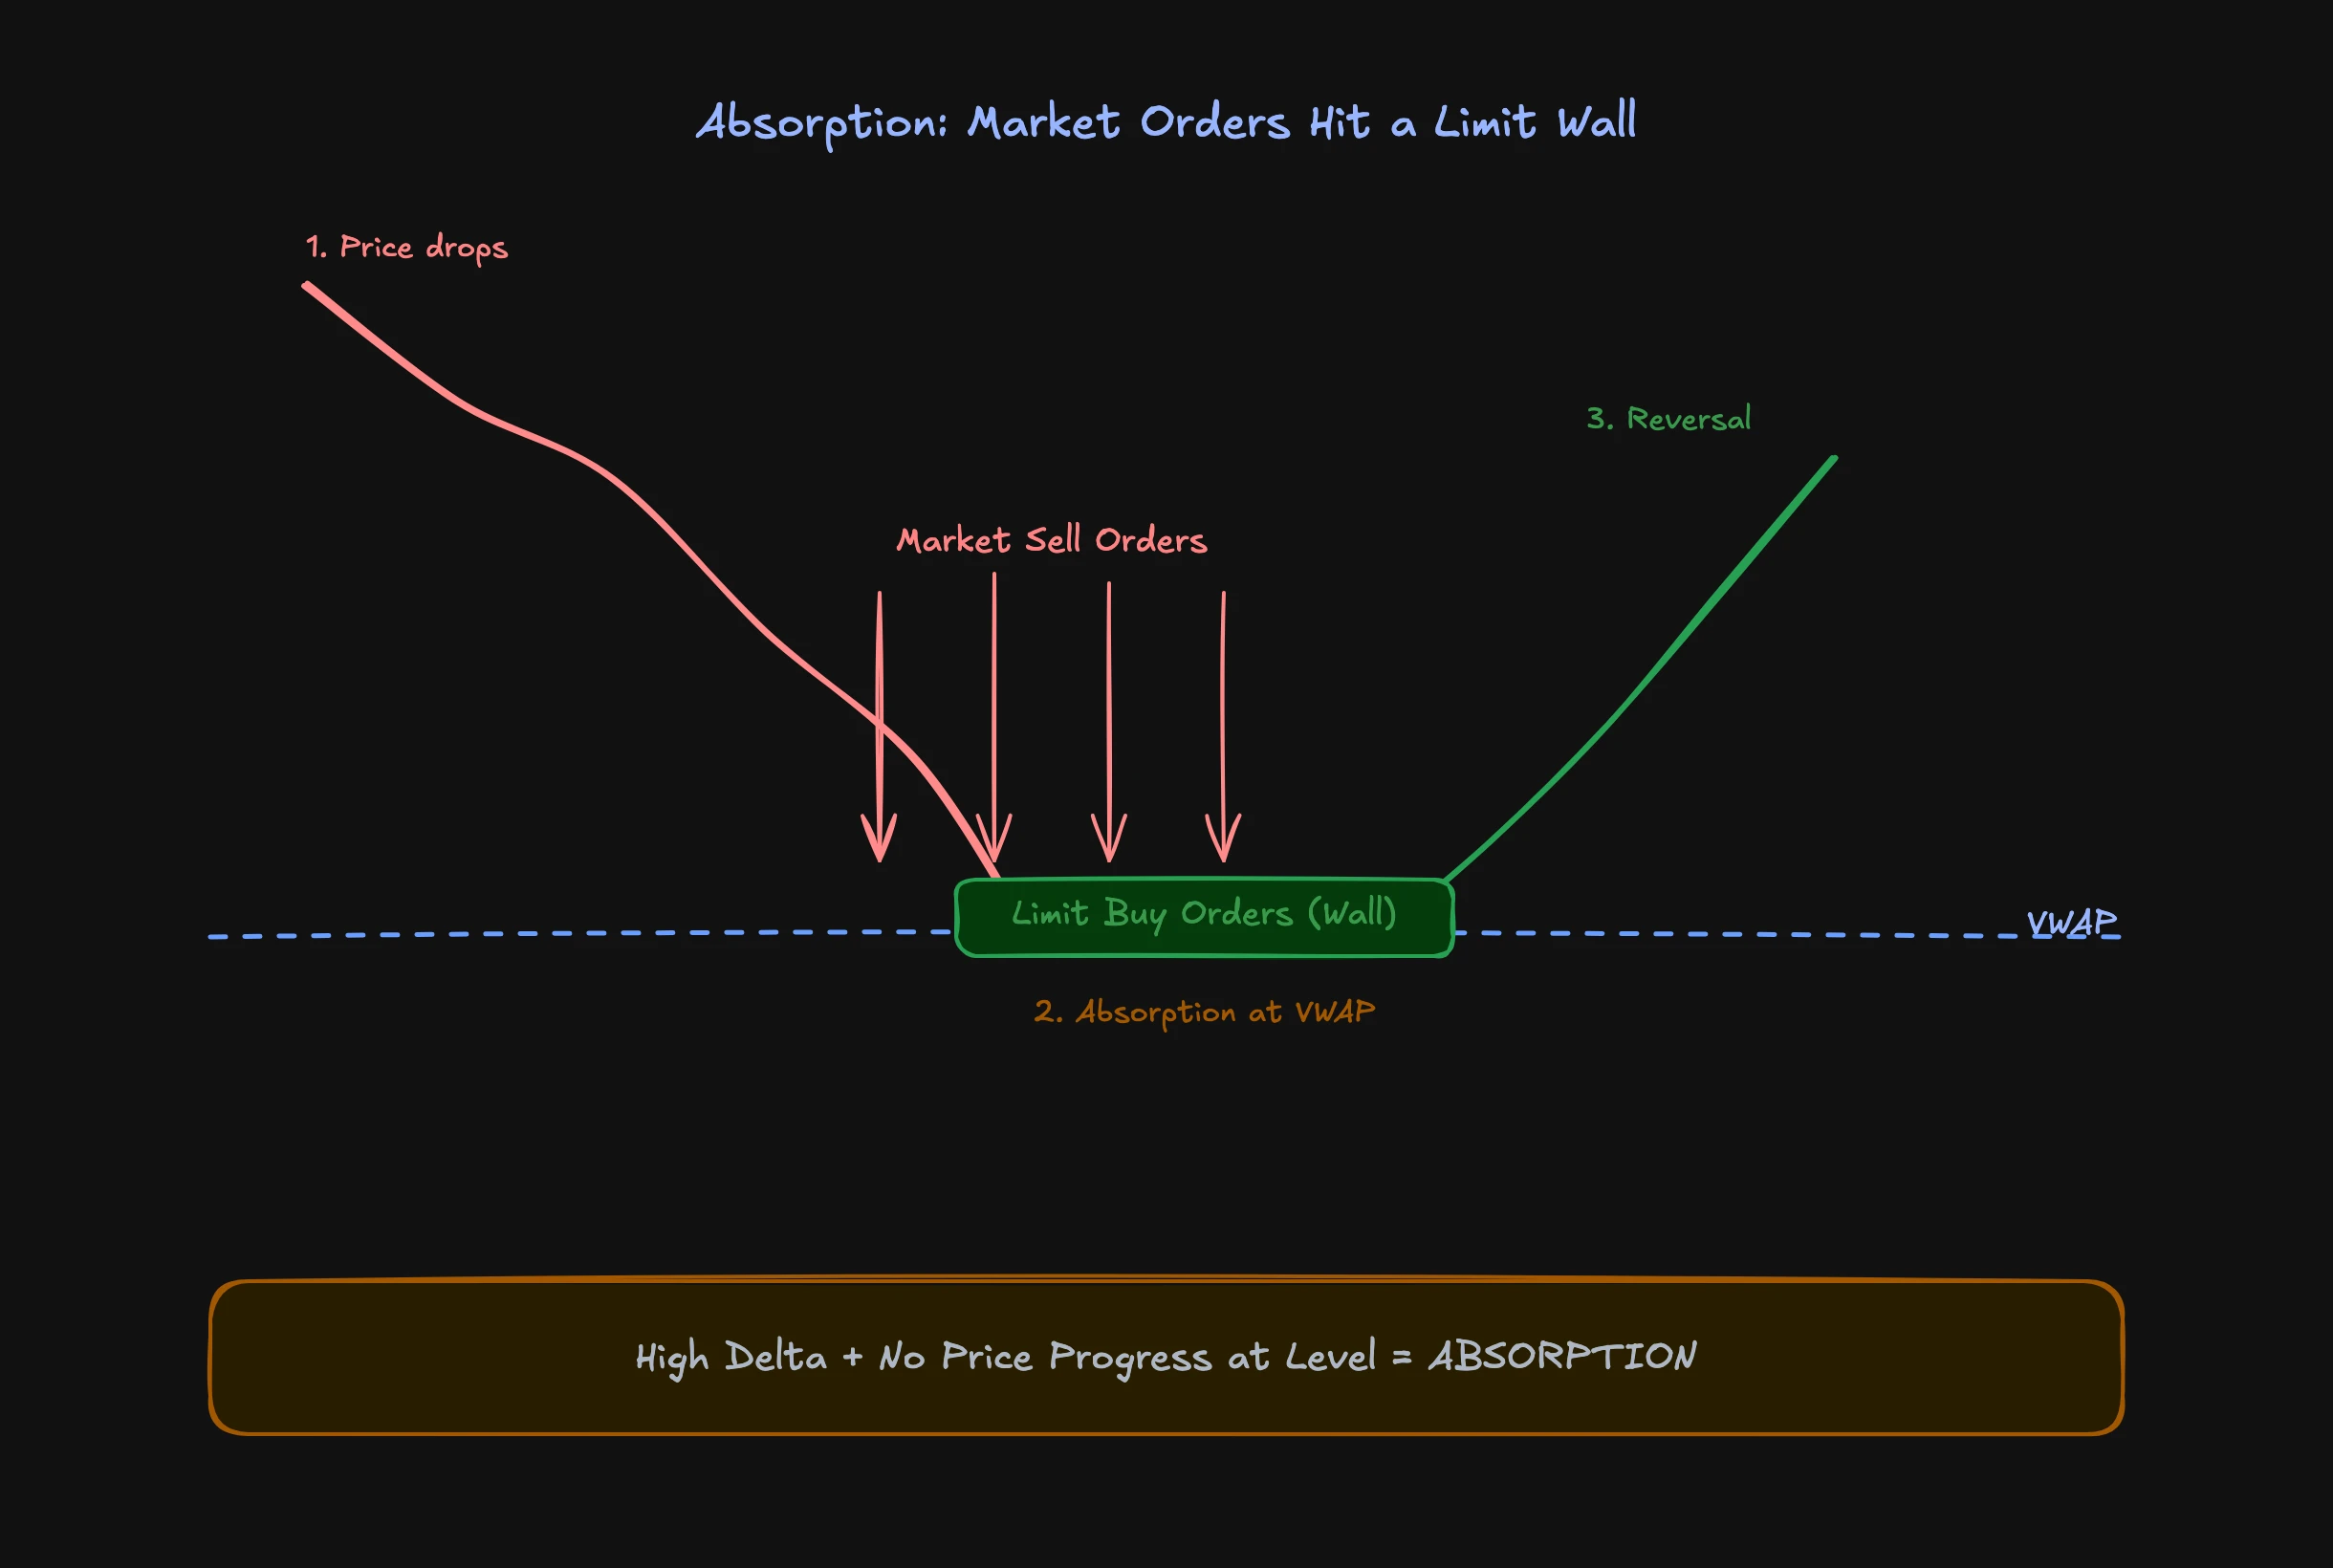
In the footprint chart, you see this as a prominent cluster: the bid side shows heavy volume on one or two price levels while price stays locked in a tight range. In time and sales, you recognize it as repeated large prints at the same price, without a break.
Where Absorptions Occur
Absorptions do not happen at random spots. They occur at levels that matter to institutional participants:
- VWAP (Volume Weighted Average Price): The most important intraday reference price
- Value Area High/Low: The boundaries of the previous day's value area
- Previous Day High/Low: Reference points that breakout traders watch
- Settlement Price: The official closing price from the previous session
When you spot an absorption, always ask first: is there a meaningful level here? If so, the probability of the absorption holding and producing a reversal goes up significantly.
Absorption Bid vs. Absorption Ask
There are two directions:
Absorption Bid: Price is falling, aggressive sellers push down, but limit buy orders stacked at the bid absorb everything. Price stops and reverses higher. This is the classic defense of a support level.
Absorption Ask: Price is rising, aggressive buyers push up, but limit sell orders stacked at the ask absorb everything. Price stops and reverses lower. This is the defense of a resistance level.
In both cases, the aggressive side loses and the passive side wins. Price goes where resistance is weakest.
What Is an Exhaustion in Order Flow?
An exhaustion occurs when a price move burns through its last energy. The market is pushing in one direction, volume surges in a final burst, but follow-through dies. The participants driving the move have worked through their orders. No new ones are coming.
The Mechanism Behind Exhaustions
Picture this: NQ has been rallying aggressively for an hour. Every pullback gets bought immediately. Then comes a final volume surge upward, the last aggressive buyers pile in, price grinds out a few more ticks. And then: silence. No more buyers. Sellers do not even need to be particularly aggressive. There is simply no demand left to hold price up. Gravity takes over.
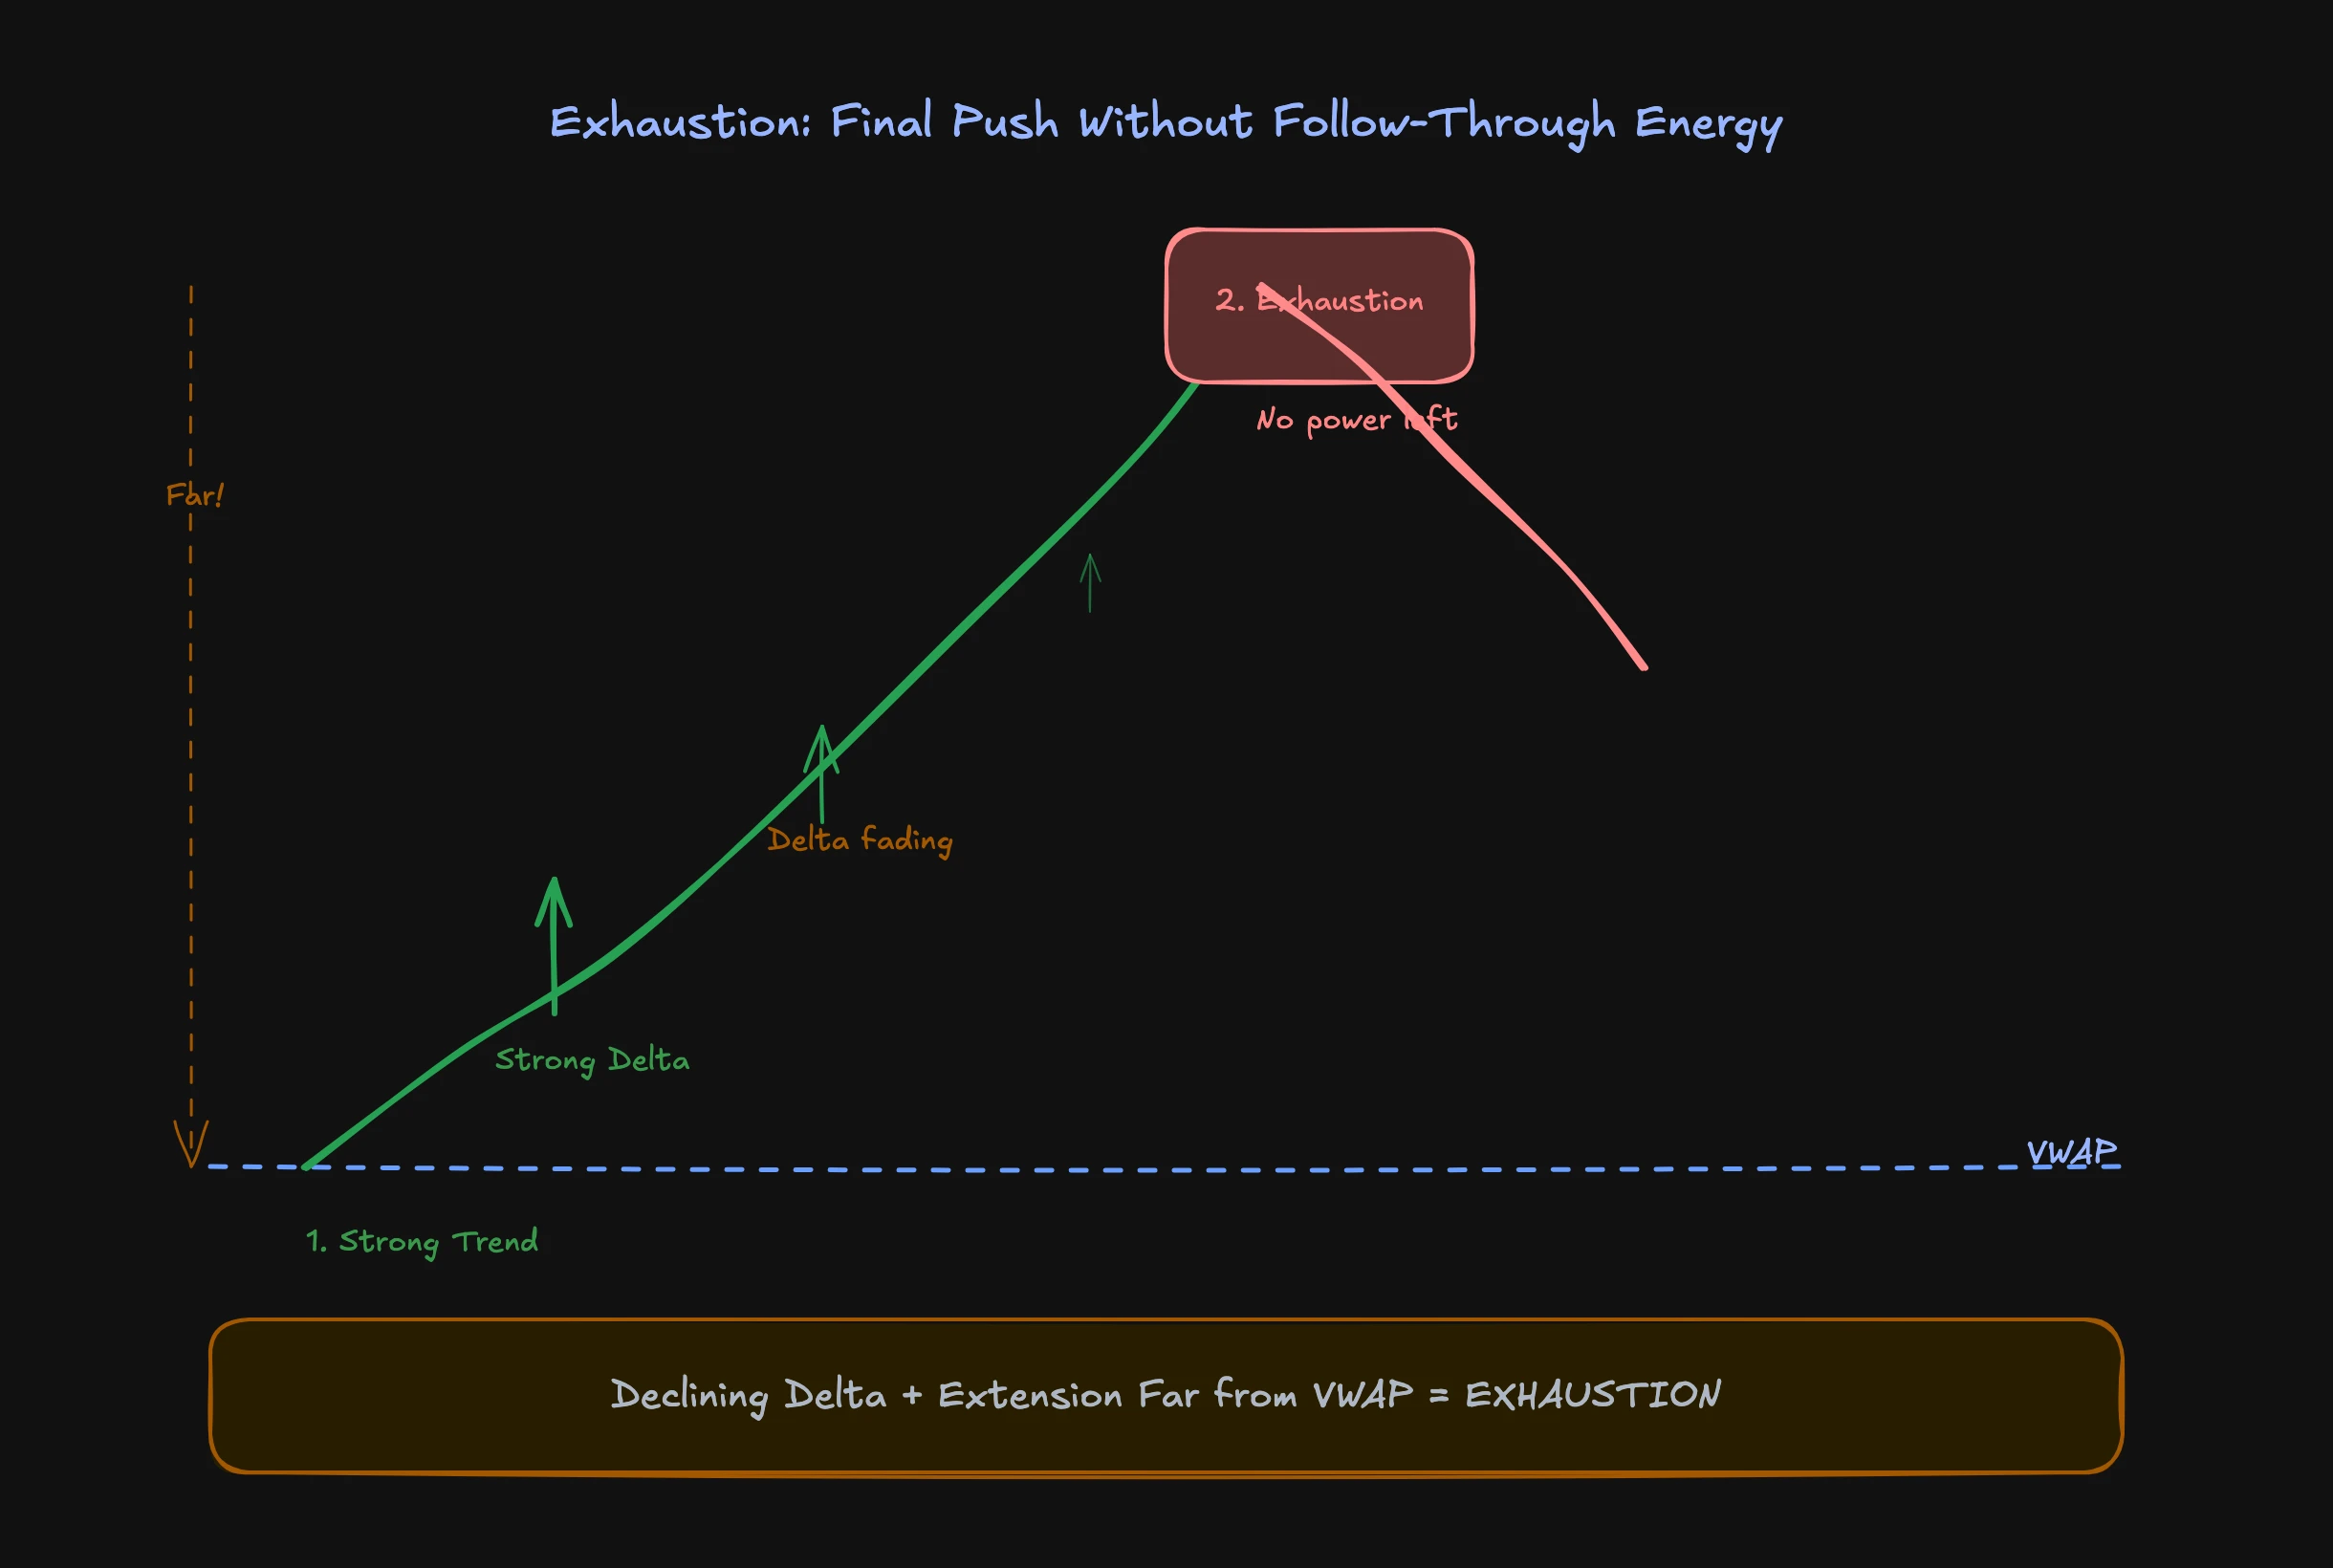
In the footprint chart, you see a telling pattern: delta on the most recent up-candles is positive, but it is shrinking compared to earlier candles. Buyers are still present, but their force is waning. In the volume profile, you notice that volume at the tip of the move is thin, because very little trading is happening up there.
Where Exhaustions Occur
This is the critical distinction from absorption. Exhaustions do not happen at key levels. They happen at extensions, far from fair value:
- Well above/below VWAP: Price has stretched far from the average
- Outside the Value Area: The market is trading in a zone with little historical volume
- At trend extremes: After multiple impulsive legs with no pullback
- At intraday extensions: When price has exceeded its typical daily range
An exhaustion at a key level would be illogical. If price turns at VWAP with high volume, you have an absorption, not an exhaustion. Exhaustion requires distance from fair value.
Exhaustion Top vs. Exhaustion Bottom
Exhaustion Top: Price rallies aggressively, the final volume burst upward is the last push. After that, no more buyers arrive. Price rolls over. Typical at the upper extreme of a strong uptrend, well above VWAP and the value area.
Exhaustion Bottom: Price sells off aggressively, the final volume burst downward is the last panic sell. After that, no more sellers arrive. Price reverses higher. Typical after panic selloffs or news-driven shocks.
Absorption vs. Exhaustion: The Critical Difference
Both signals produce reversals, but through fundamentally different mechanisms. Knowing the difference is not academic. It determines how you manage the trade.

Comparison Table
| Criterion | Absorption | Exhaustion |
|---|---|---|
| Location | At key levels (VWAP, VA, prev H/L) | At extensions (far from fair value) |
| Volume | High volume, price does not move | Volume burst, then silence |
| Delta | High delta with no price progress | Delta shrinks with each wave |
| Who acts? | Passive defender absorbs | Aggressive side runs out of steam |
| Price behavior | Price stays in tight range | Price makes final push, then stalls |
| Footprint signal | Heavy clusters on 1-2 levels | Thin volume at the tip |
| Tape signal | Repeated large prints, no break | Final prints with no follow-through |
| Reversal reason | Defense by large participant | Exhaustion of the aggressive side |
Context Is Everything
The most important lesson I can give you about these signals: context determines which signal you are looking at. Not volume alone, not delta alone, not price behavior alone. It is the combination of volume, delta, price, AND location.
If you see high volume and high delta with no price movement, and price is at VWAP, you have an absorption. If you see high volume and high delta with no price movement, but price is far from VWAP at the top of a strong rally, you probably have an exhaustion where the last buyers are being absorbed. But the mechanism is different: there is no large defender here. There is simply no energy left for follow-through.
Effort vs. Result: The Universal Principle
Behind both signals lies a simple concept: effort vs. result. How much effort (volume, delta) goes into a move, and what comes out of it (price movement)?
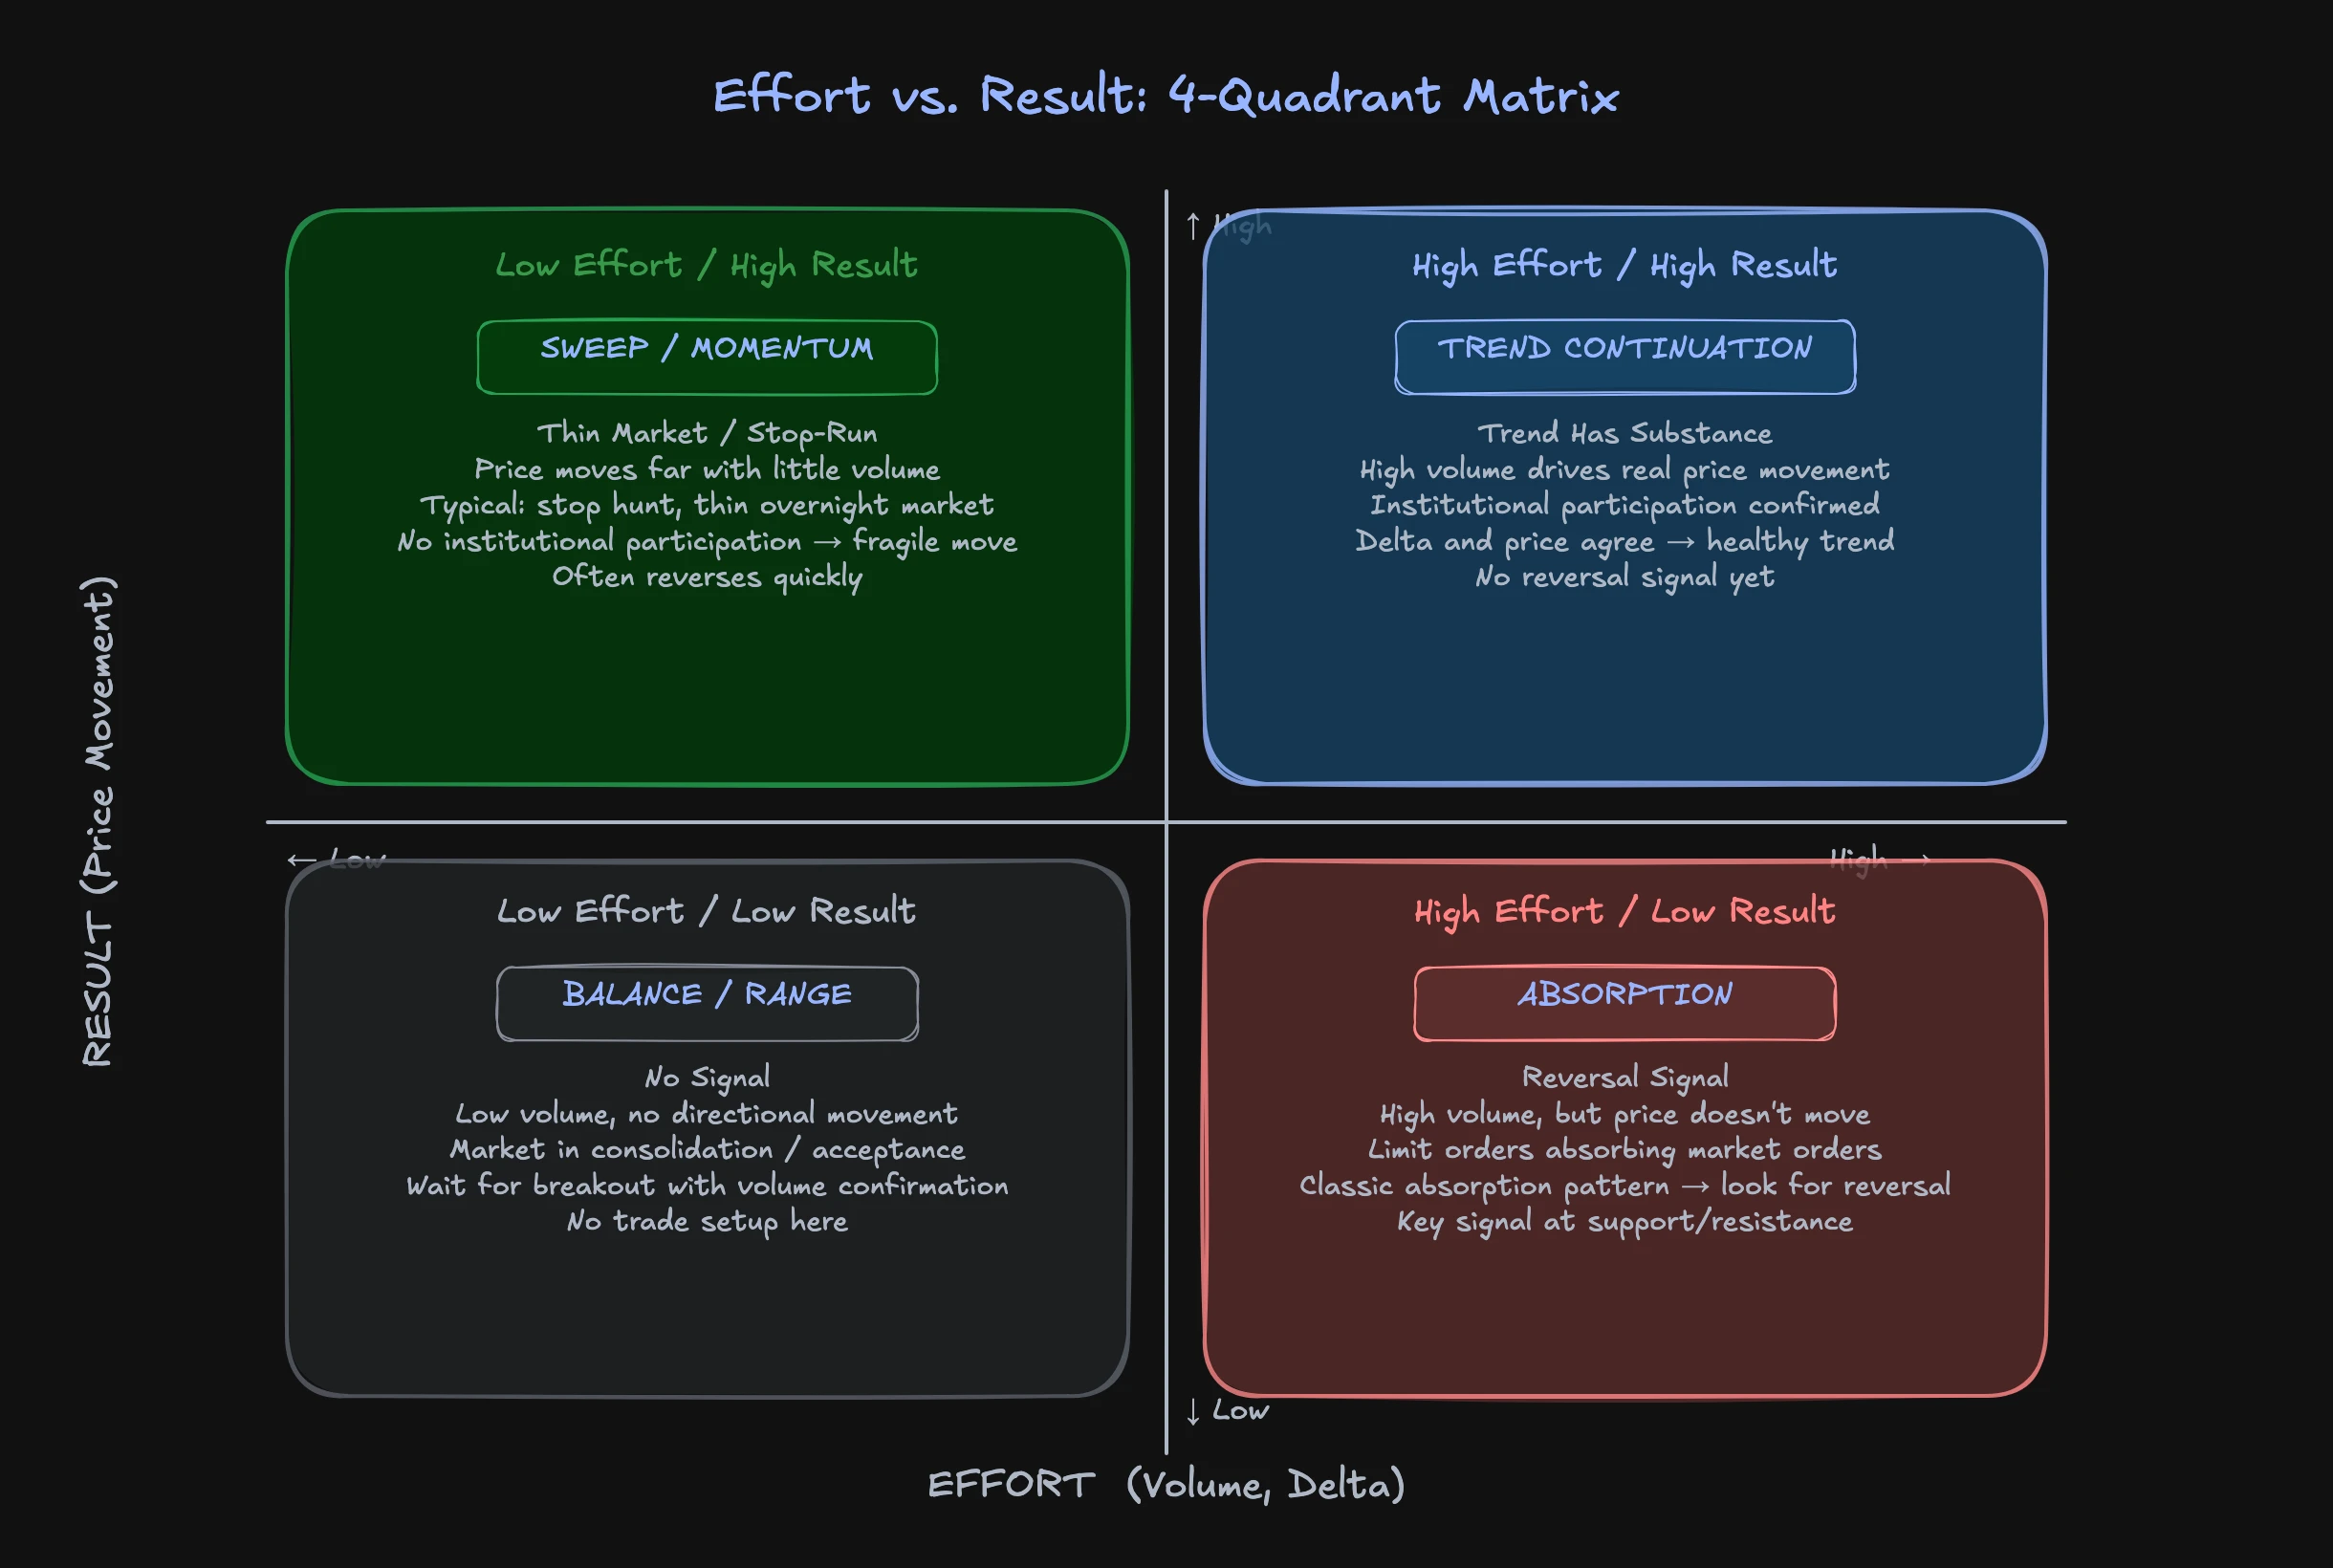
The Four Combinations
High Effort, Low Result (Absorption): Lots of volume, strong delta, but price barely moves. Someone is absorbing the pressure. This is the classic absorption signal.
High Effort, High Result (Trend Continuation): Lots of volume, strong delta, and price moves sharply. The aggressive side is winning. The move has substance and is likely to continue.
Low Effort, High Result (Sweep/Momentum): Low volume, but price moves sharply. This happens in thin markets or during stop runs. Price moves fast because there is no opposition.
Low Effort, Low Result (Balance/Range): Low volume, little price movement. The market is in balance. No signal, no trade.
Once you internalize this framework, you do not need complicated setups. You observe effort and result at the right location, and the signals reveal themselves.
Identifying Absorptions in the Footprint Chart
The footprint chart is the best tool for spotting absorptions in real time. It shows you individual transactions at every price level, letting you read effort vs. result directly.
Step-by-Step Identification
-
Identify the key level. Mark VWAP, value area boundaries, previous day high/low on your chart. Without a level, there is no absorption.
-
Watch volume at the level. When price reaches the level, look for a spike in volume. During an absorption, you will see clearly above-average volume concentrated on one or two price levels.
-
Check delta. Strong delta (positive or negative) with no price movement is the core signal. The aggressive side is pushing, but price is not responding.
-
Watch the follow-through. After the volume gets absorbed, you typically see a quick move in the opposite direction. The aggressive traders who just got absorbed need to cover their positions, which amplifies the reversal.
-
Confirm with the tape. In time and sales, you see repeated large prints at the same price. The tape shows you the absorption in real time, before the footprint candle closes.
Common Mistakes in Identification
The most common mistake: treating every high-volume cluster as an absorption. High volume in a running trend where price is moving is not absorption. It is trend continuation. Volume alone tells you nothing. Only the combination with the price reaction (or lack thereof) makes it a signal.
Another mistake: looking for absorptions at irrelevant levels. A random price point with no historical significance where price briefly pauses is not an absorption. Real absorptions need a reason for someone to defend that level.
Identifying Exhaustions in the Footprint Chart
Spotting exhaustions is more subtle than spotting absorptions, because you are not looking for a single price level but for a pattern across multiple candles.
Step-by-Step Identification
-
Identify the trend direction and strength. Exhaustions need a preceding trend. The longer and stronger the trend, the more likely an exhaustion becomes.
-
Measure the distance from fair value. Is price far from VWAP? Trading outside the value area? If yes, the probability of exhaustion rises.
-
Compare delta across recent candles. Delta on the current candle should be smaller than on previous candles, even though price is still pushing in the trend direction. The force is fading.
-
Watch for the final volume surge. There is often a last burst, a climax print, where volume briefly explodes. After that: silence. This is the moment the last traders jump into the move.
-
Wait for the confirmation print. After the exhaustion, you typically see a candle in the opposite direction with volume. This confirms that the exhaustion is real and not just a brief pause before the next impulse leg.
When an Exhaustion Is NOT an Exhaustion
Not every pause in a trend is an exhaustion. In strong trends, brief consolidations are normal before the next impulse wave. The difference: in a real exhaustion, the market is far from fair value and the delta pattern shows declining force. In a consolidation, the market is still near fair value and delta remains stable.
Absorptions and Exhaustions Working Together
In practice, absorption and exhaustion rarely appear in isolation. An exhaustion often follows a failed absorption, or an absorption forms after a trend has exhausted itself.
Sequence 1: Exhaustion Followed by Absorption
Price rallies all day, exhausts itself at the extension, and reverses. On the pullback to VWAP, an absorption forms: an institutional buyer defends VWAP with limit orders. The result is a new rally from a solid foundation.
Sequence 2: Absorption Followed by Weak Counter-Move
Price drops to the previous day low and gets absorbed there. The bounce is weak and exhausts itself after a few minutes. This tells you the absorption stopped the decline, but there is not enough demand to push price sustainably higher. Result: price stays in a tight range.
Recognizing these sequences takes practice, but they give you a far clearer picture than any single signal in isolation.
Common Beginner Mistakes and How to Avoid Them
Mistake 1: Trading the Signal Without Context
Volume looks high, so it must be an absorption? Wrong. Without the right level, high volume is meaningless. Before you look for the signal, identify the relevant levels. Then check whether anything is happening at those levels.
Mistake 2: Anticipating Exhaustion Too Early
Many traders try to predict the top or bottom of a move. "The trend has been running for a while, this HAS to be an exhaustion." Trends can run longer than your account can handle. Wait for the actual exhaustion pattern: declining delta, final push, then confirmation.
Mistake 3: Confusing Absorption and Exhaustion
When you see high volume at a key level and price reverses, it is tempting to call it an absorption. But if price has been moving aggressively before the reversal and the level just happens to coincide with the end of the move, it could be an exhaustion that happens to occur at a level. The difference: in an absorption, you see the battle at the level. In an exhaustion, you see force diminishing.
Mistake 4: Searching for Too Many Signals
Absorptions and exhaustions do not happen every few minutes. On a normal NQ trading day, you might get two to three clear signals. If you are finding ten, you are searching too aggressively and not filtering enough.
Summary and Practical Application
Absorption and exhaustion are not just two signals among many. They are the two fundamental mechanisms through which order flow turning points form. Everything else you see in charts (stacked imbalances, failed structures, chart story patterns) can be traced back to one of these two mechanisms.
Your workflow should be:
- Identify the key levels for the day (VWAP, VA, previous day high/low)
- Determine whether the market is near fair value (absorption possible) or at an extension (exhaustion possible)
- Observe effort vs. result at the relevant location
- Only trade clear signals with confirmation
That sounds simple. And in principle, it is. The difficulty is not in understanding but in the patience to wait for the right signal, and in the experience to distinguish real signals from noise.
Frequently Asked Questions
What is the difference between absorption and exhaustion in order flow?
Absorption occurs at key levels when a passive market participant soaks up aggressive orders without price moving. Exhaustion occurs at extensions far from fair value when the driving force behind a move fades. Both produce reversals, but the mechanism is fundamentally different: absorption is active defense, exhaustion is the end of offensive energy.
How do I recognize an absorption in the footprint chart?
Look for price levels where above-average volume occurs but price does not move. In the footprint, you see large clusters concentrated on one or two levels. Delta shows strong aggression from one side, but no price result. Make sure the level has fundamental significance (VWAP, value area, previous day high/low).
Can absorption and exhaustion occur at the same time?
Not simultaneously, but they can follow each other closely. A typical scenario: price exhausts itself at an extension, pulls back, and then gets caught by an absorption at VWAP. These sequences often produce the best trades because you have two confirming signals.
How many absorptions and exhaustions happen per day?
On an average trading day in NQ or ES, you typically see two to four clear signals. Most of the time, the market is either in balance or in a trend where effort and result align. Real absorptions and exhaustions are the exception, not the rule.
Do I need special software to spot these signals?
You need a tool that shows order flow at individual price levels. A footprint chart is ideal, and order flow software like ATAS, Sierra Chart, or Quantower provides the necessary data. Time and sales complements as real-time confirmation. Standard candlestick charts without order flow data are not sufficient.
In our mentoring program, you'll learn these concepts in over 1,500 video lessons with real chart examples. The absorptions and exhaustions module alone includes 3 video lessons plus 4 practical exercises that guide you through real market examples step by step.