Stacked Imbalances and Engulfing: Spotting Aggressive Order Flow Patterns
Stacked imbalances and engulfing patterns are two of the most aggressive signals you can observe on a footprint chart. A stacked imbalance tells you WHERE institutional urgency is building across consecutive price levels. An engulfing pattern tells you WHEN momentum has flipped entirely within a matter of seconds. Both patterns are only meaningful when read in the context of broader order flow data.
Risk Disclaimer: Trading futures and other financial instruments involves significant risk of loss. Past results are not indicative of future performance. Only trade with capital you can afford to lose.
Early in my institutional career, I learned that isolated imbalances on a footprint chart mean very little. Markets constantly produce short-lived asymmetries that get corrected within seconds. What actually gets my attention are patterns: three, four, five consecutive levels where one side clearly overwhelms the other. Or a single bar that completely reverses the volume and delta of the previous bar. These are not random fluctuations. This is institutional activity leaving a footprint.
In this article, I break down both patterns in detail, show you how to spot them on NQ and ES, and explain why trading them in isolation is a recipe for frustration.
What a Stacked Imbalance Looks Like on the Footprint
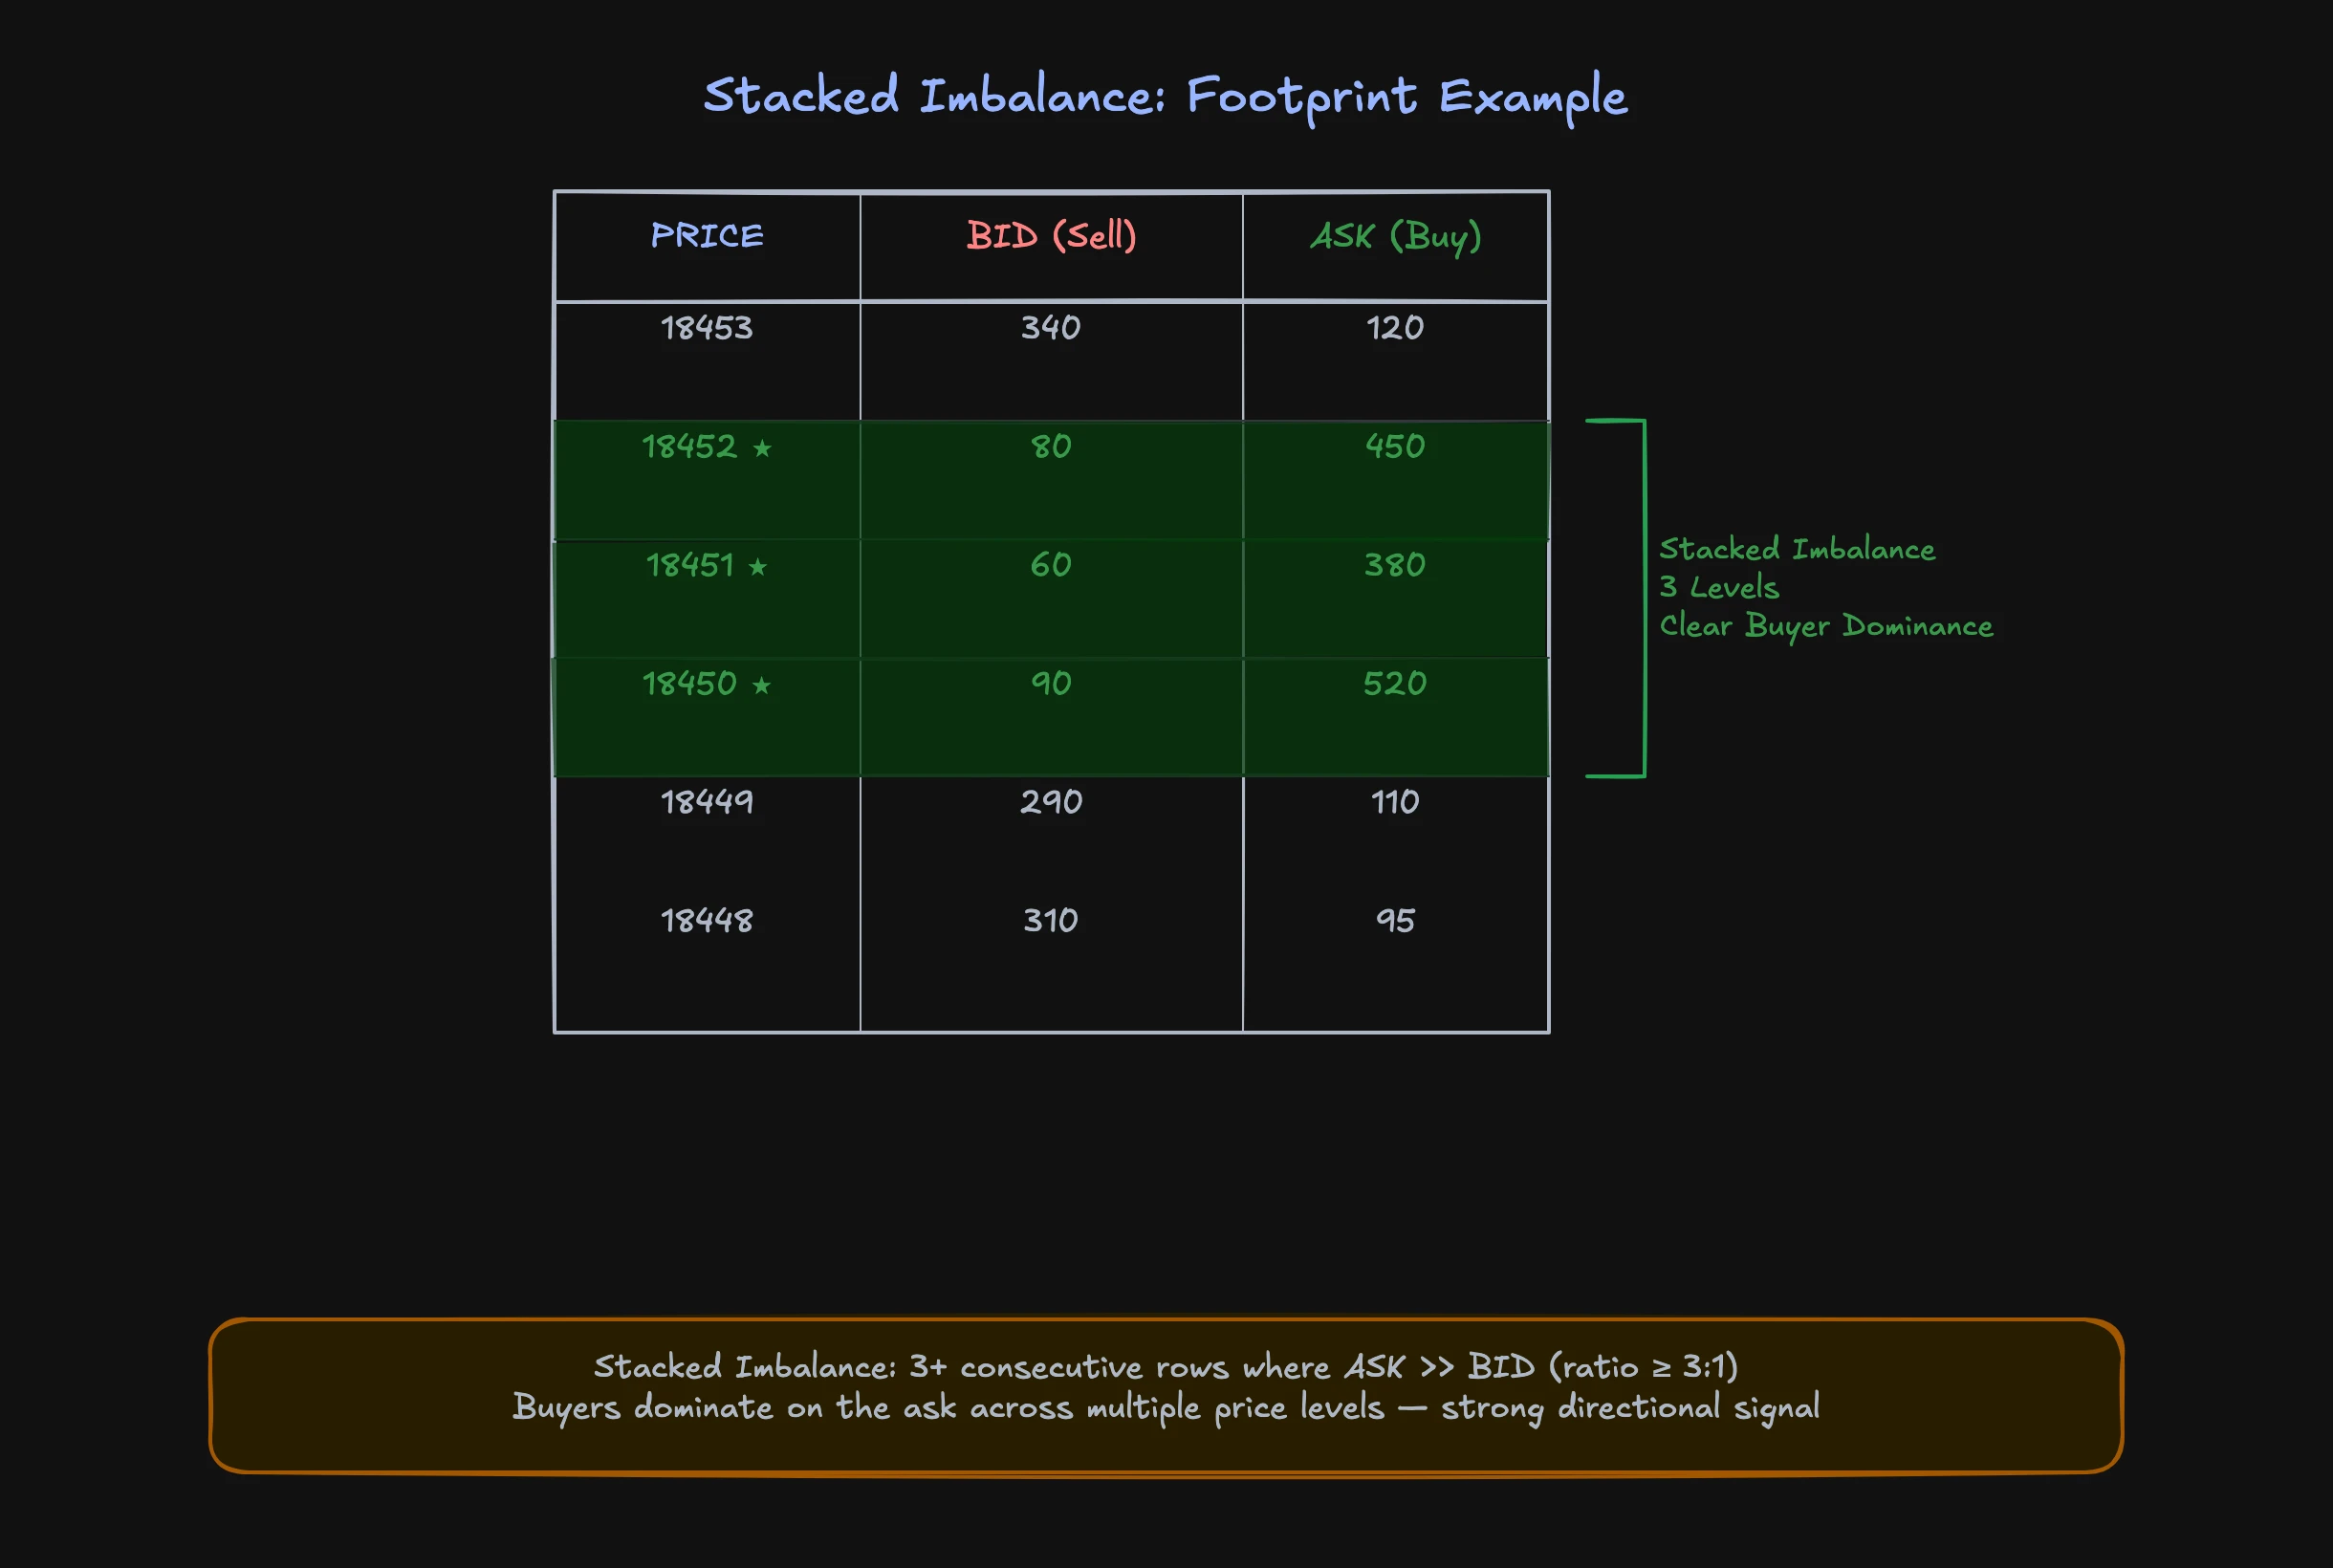
A stacked imbalance forms when three or more consecutive price levels within a single bar show one side clearly dominating the other in terms of volume ratio. On the footprint, you see this as a diagonal chain of highlighted cells, all pointing in the same direction.
Picture a footprint bar on NQ. At level 18,450, you see 80 contracts on the bid side and well over 400 on the ask side. One tick lower at 18,449, the same picture: low bid numbers, high ask numbers. And again at 18,448. Three levels in a row where aggressive buyers are clearly dominating.
This is not normal market activity. Someone needs to build a position urgently and is willing to aggressively lift the ask across multiple price levels. In most cases, these are institutional participants or algorithms executing a large order within a tight time window.
The diagonal signature
What makes stacked imbalances distinctive is their visual form. Because the imbalance calculation on a footprint runs diagonally (ask volume at one level compared to bid volume at the level below), stacked imbalances create a diagonal staircase pattern on the chart. This signature is recognizable at a glance and clearly different from scattered single-level imbalances.
In our mentoring program, we work through four dedicated stacked imbalance exercises, from identification and marking to practical application on live charts. The reason is simple: you need to recognize this pattern reflexively, without thinking. If you start comparing numbers manually, the move is already over.
When a stacked imbalance actually matters
Not every stacked imbalance leads to a price move. The deciding factor is context. A stacked imbalance at a known absorption level carries an entirely different meaning than one forming in the middle of a choppy consolidation.
Always ask yourself: Is this stacked imbalance forming at a level already identified as relevant through the volume profile or through prior absorption? Does it confirm a direction that the cumulative volume delta is already showing? If yes, you have a strong confluence signal. If not, it may just be a brief liquidity surge with no follow-through.
Engulfing in Order Flow: When Momentum Flips
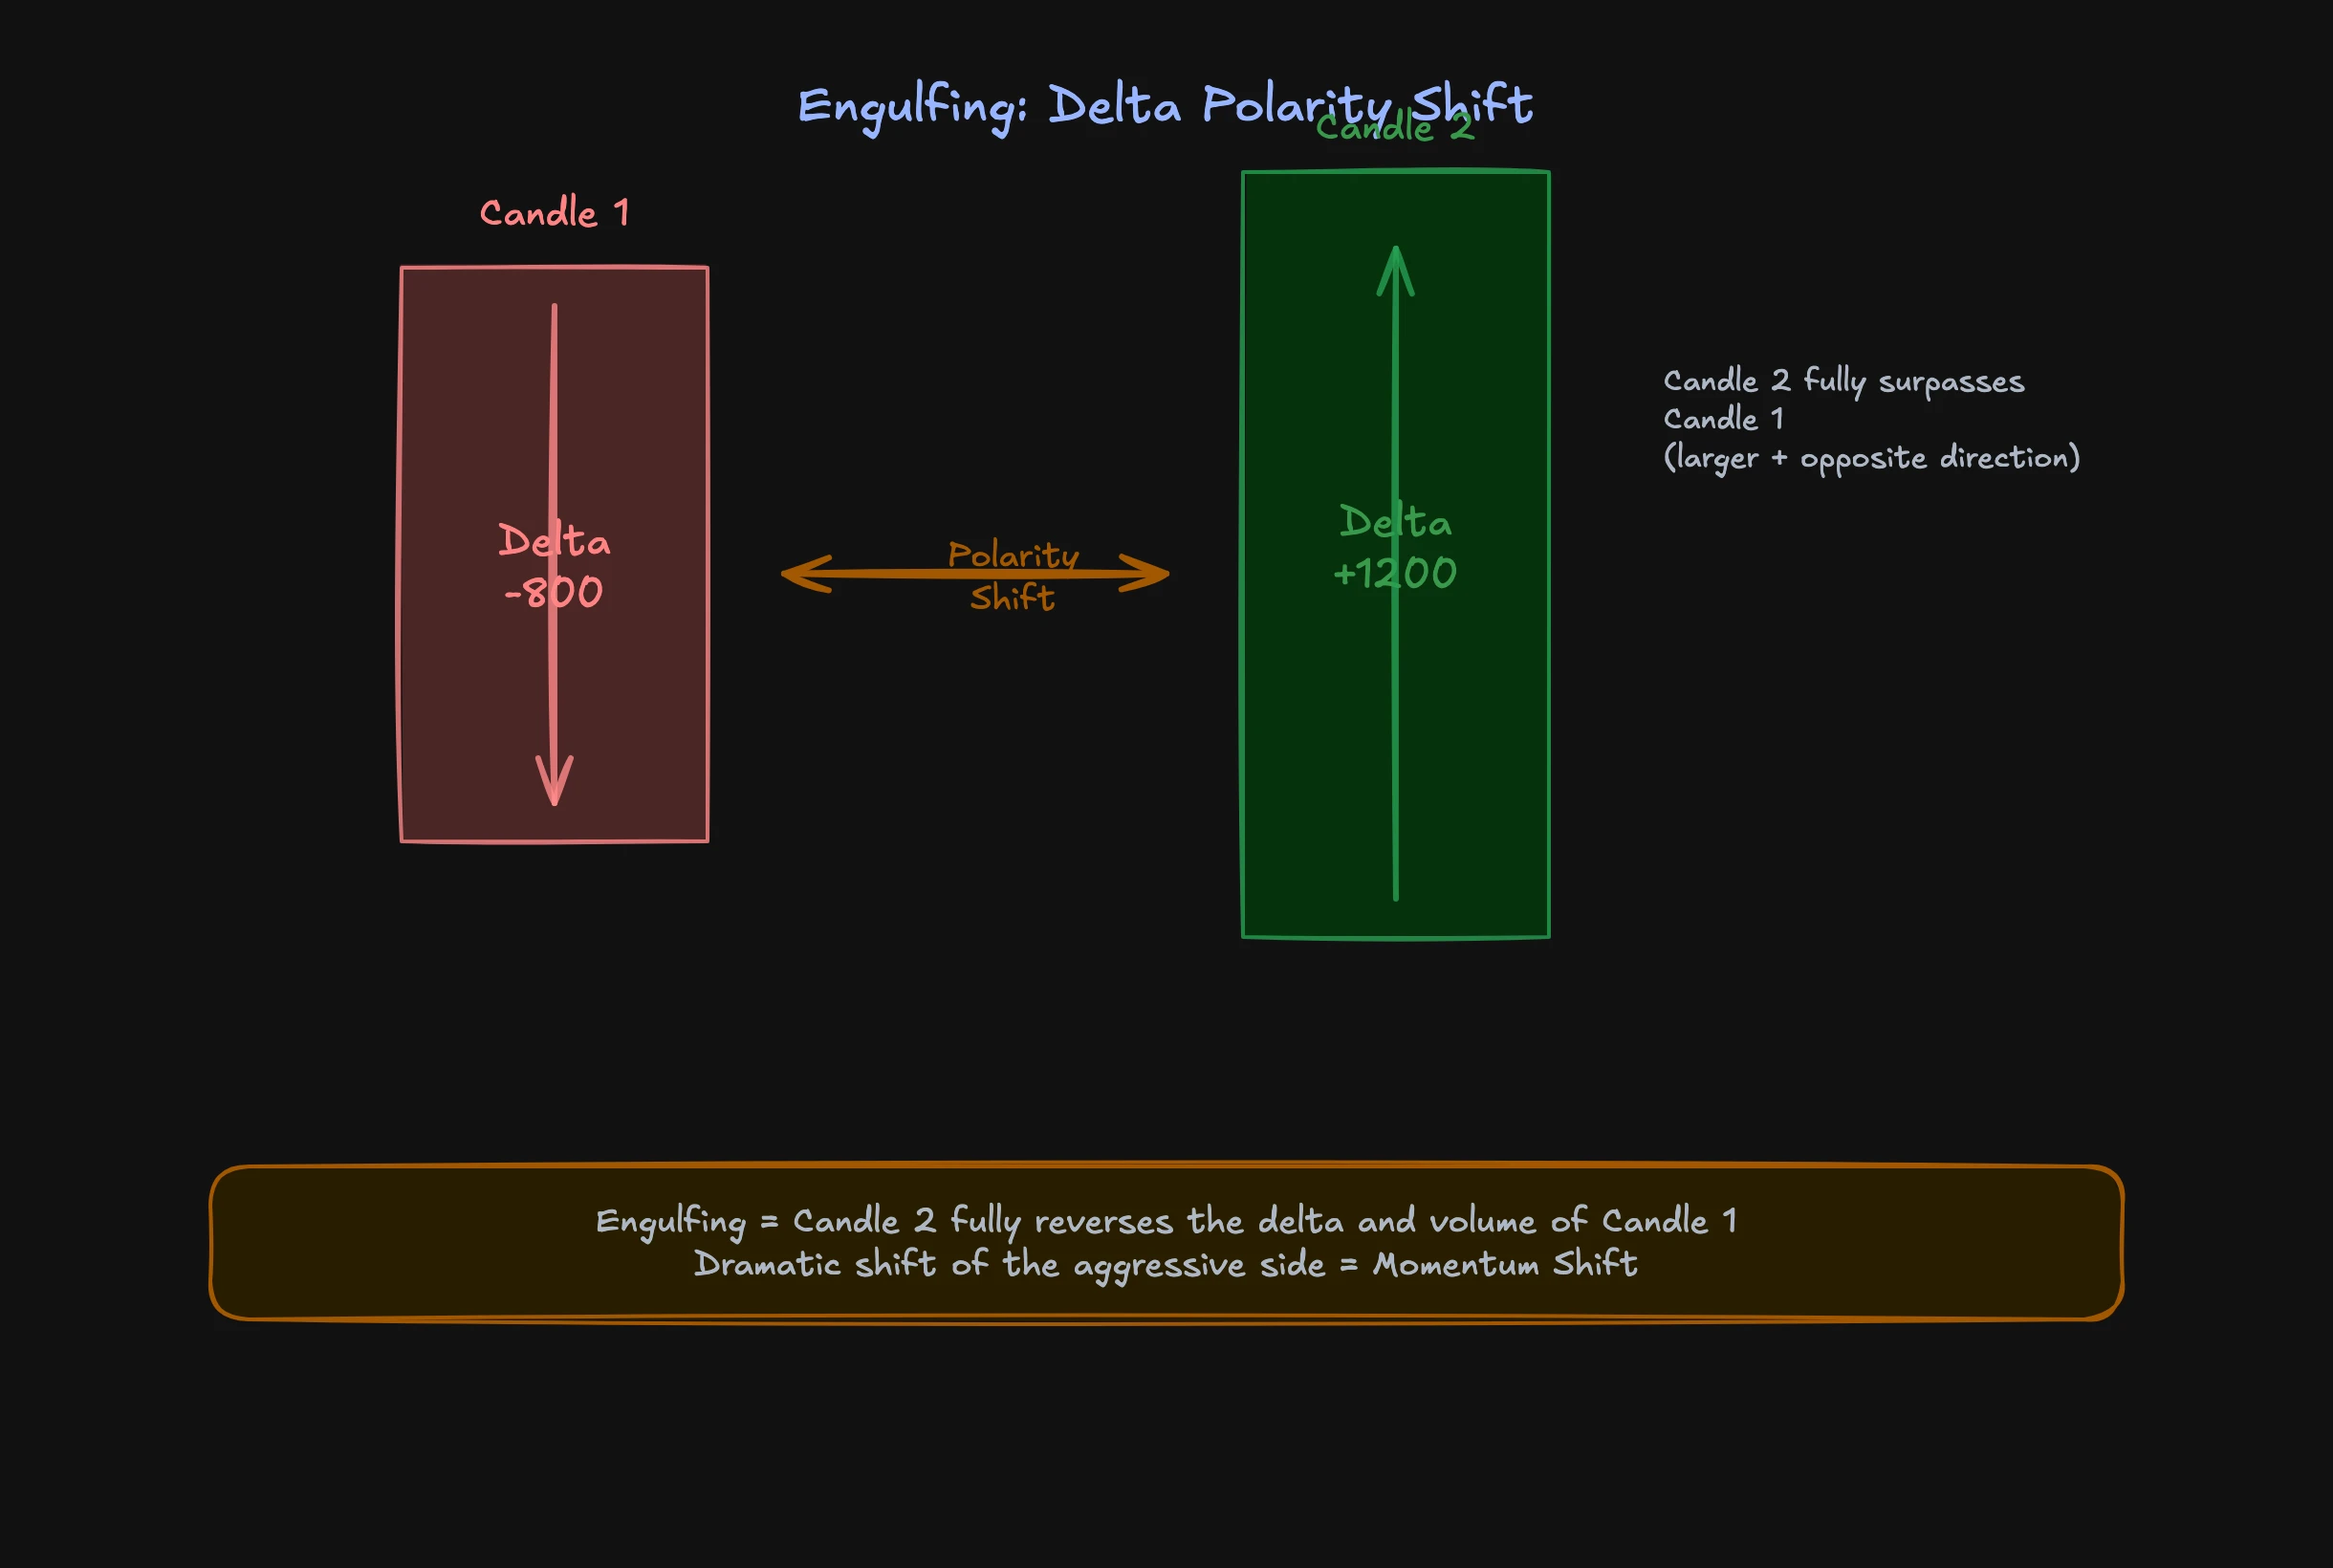
An engulfing pattern in order flow is fundamentally different from the classic candlestick engulfing you know from technical analysis. In order flow, it is not about the candle formation. It is about the delta shift: the current bar completely reverses the total volume and delta of the previous bar.
Imagine two consecutive bars. The first has a strongly negative delta of -800, with price dropping. The second bar flips everything: positive delta of +1200, price pushing above the high of the first bar. This is not a normal pullback. This is a dramatic polarity reversal in the aggressive side of the market.
What separates order flow engulfing from candlestick engulfing
A candlestick engulfing tells you the second candle's price range envelops the first. That tells you something about the price spread, but nothing about the actual activity behind it. An order flow engulfing tells you that the entire aggressive side has flipped. The sellers who just dominated are being overrun by a wave of aggressive buyers.
On NQ, I see this regularly at intraday turning points: the market pushes aggressively in one direction, delta is strongly negative, and then a single bar reverses everything. The delta does not just turn positive; it significantly exceeds the negative value of the previous bar. That is the moment the counterparty seizes control.
We also work through four dedicated engulfing exercises in our mentoring. Recognizing the pattern is the easy part. The challenge lies in identifying the right context for it.
Stacked Imbalance vs. Engulfing: Two Different Questions
These two patterns answer fundamentally different questions. The stacked imbalance is spatial and price-based: it shows you WHERE institutional urgency exists at specific price levels. The engulfing is time-based: it shows you WHEN momentum shifts from one bar to the next.
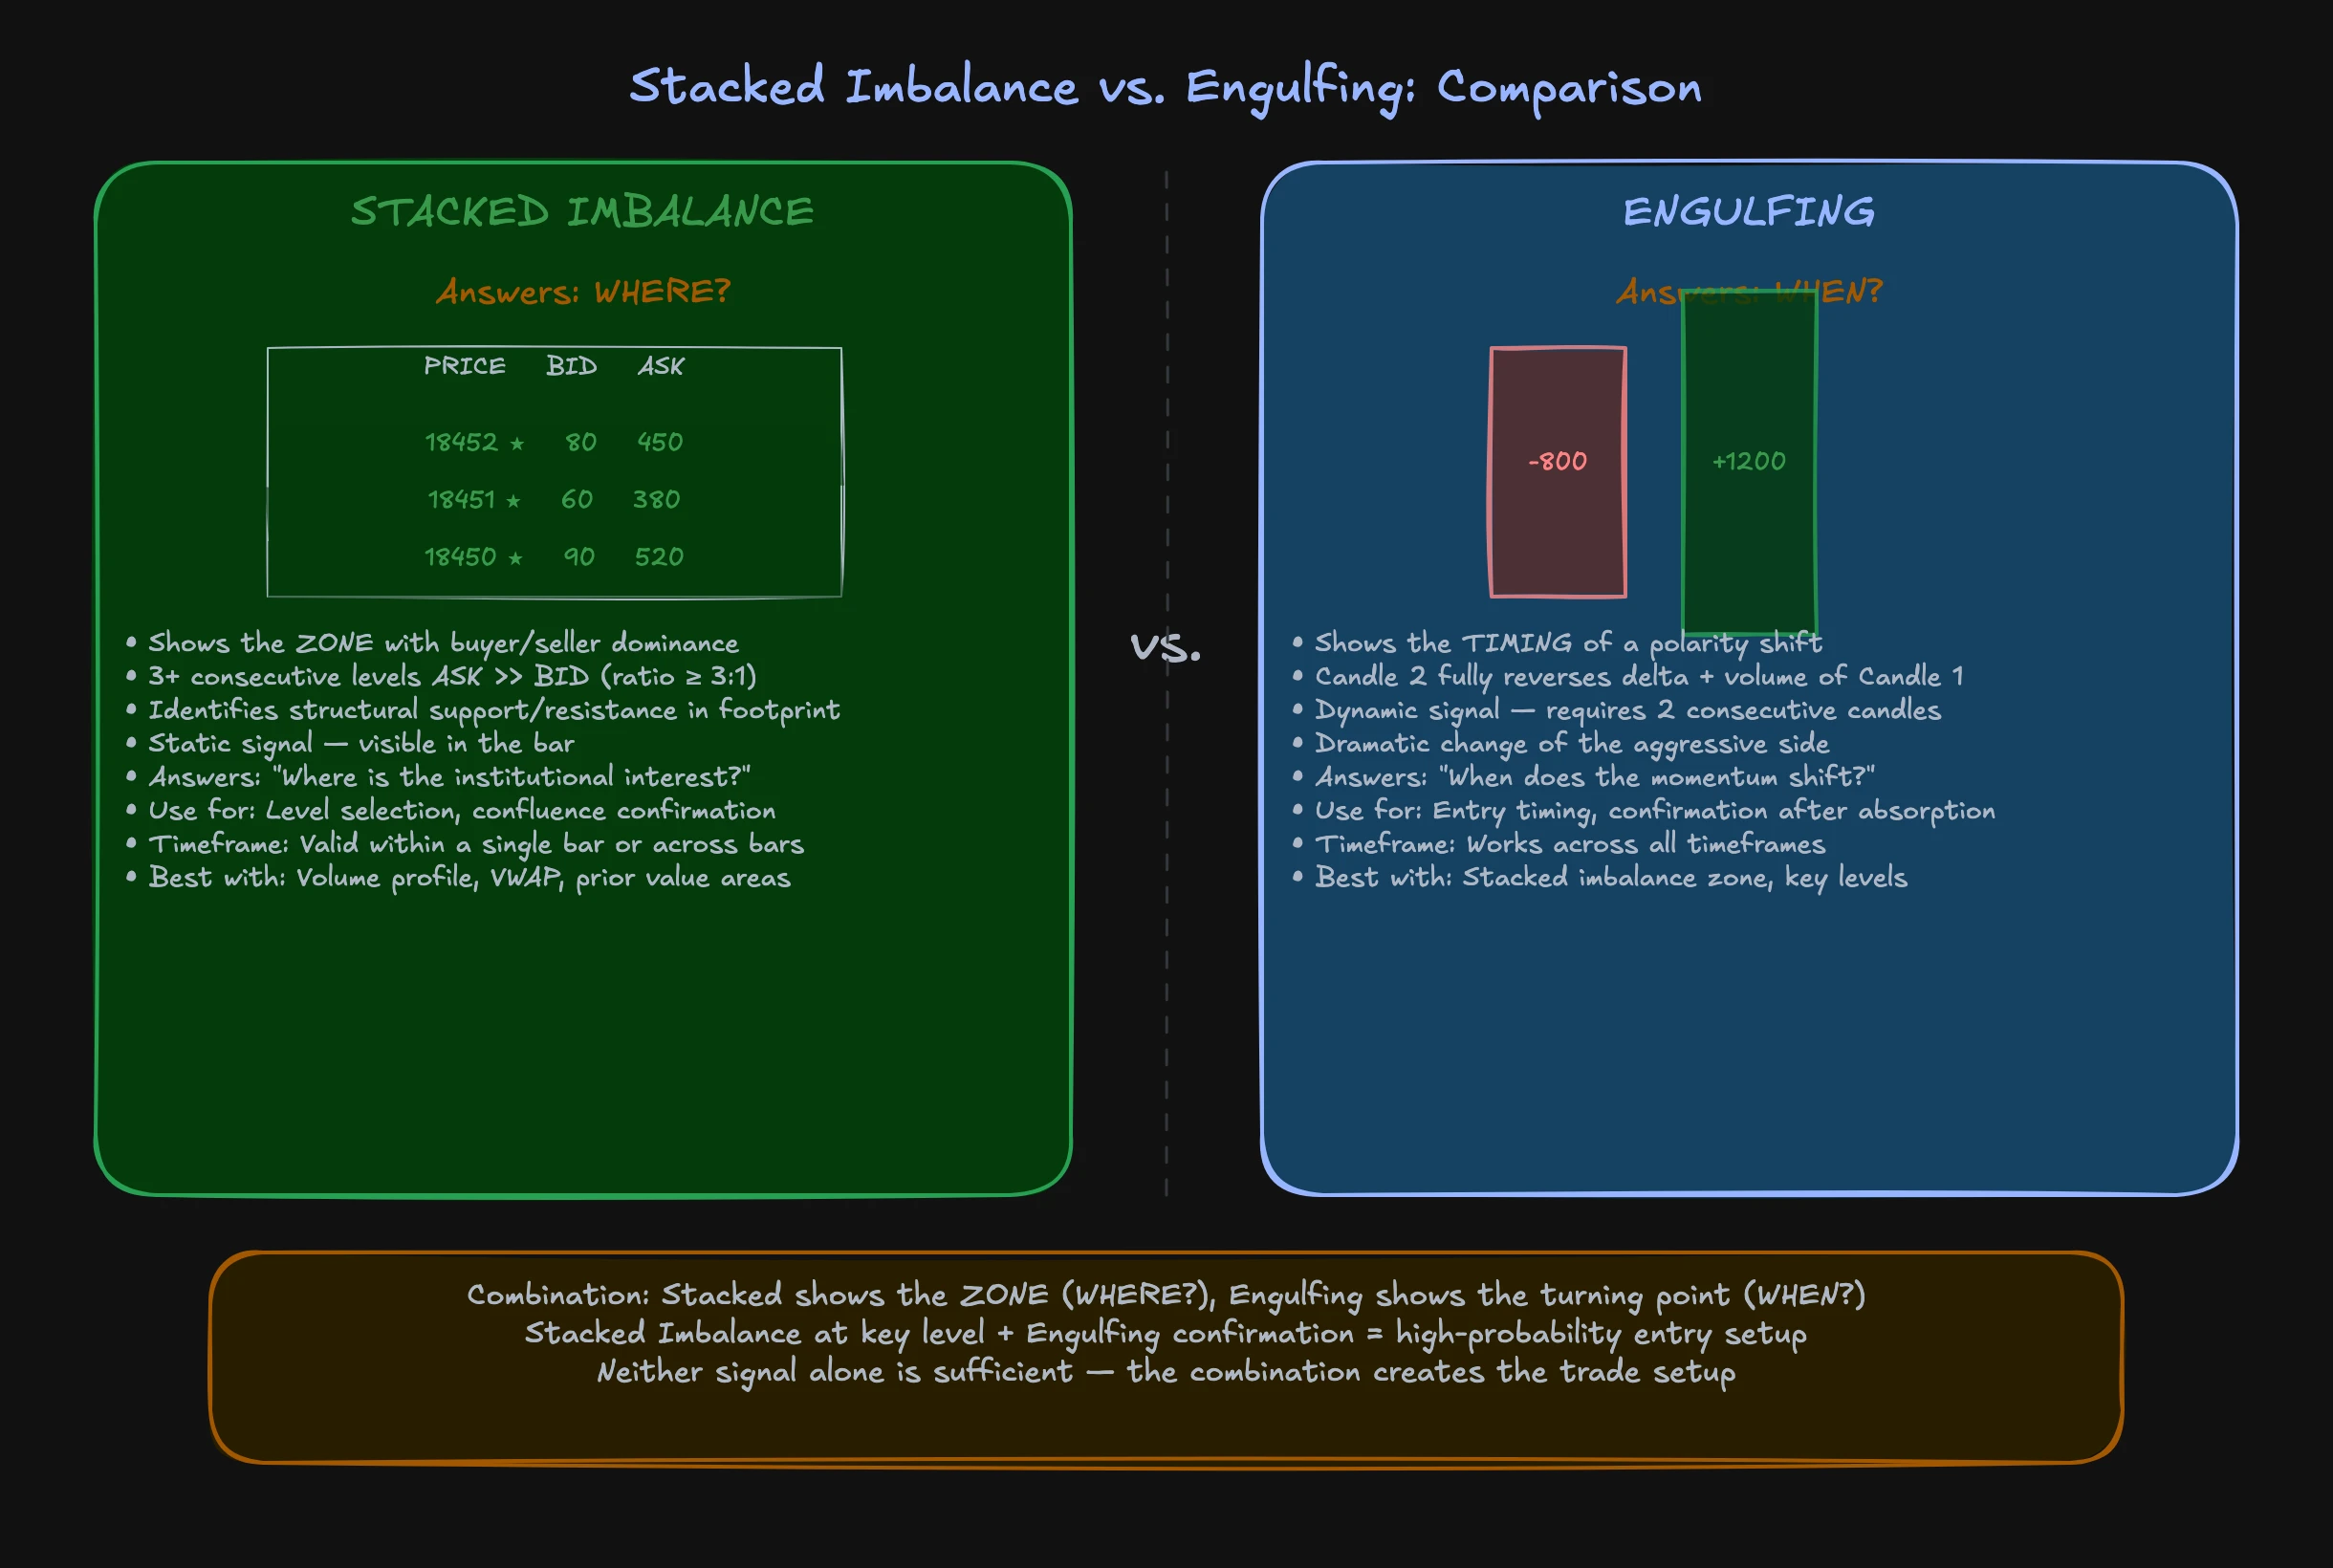
In practice, they complement each other. A stacked imbalance shows you the zone where aggressive orders are concentrated. An engulfing shows you the moment when the opposing side takes over. When you see both together, for example a stacked imbalance on the buy side followed by a bearish engulfing, then the buying pressure was not strong enough and the counterparty has taken control.
Combining with other order flow signals
You should never trade stacked imbalances or engulfing patterns in isolation. I cannot stress this enough. Both are confirmation signals, not entry signals.
A stacked imbalance confirms that aggressive activity is happening at a specific level. But whether that level holds or breaks, you only learn from the broader context: What is the CVD doing? Are there absorptions on the opposing level? Does the direction align with the higher timeframe market structure?
An engulfing confirms that momentum has flipped. But a single bar can also be a fakeout, especially during volatile NQ sessions. Only when the engulfing occurs at a relevant level, perhaps after a failed stacked imbalance in the opposite direction, do you have a high-conviction signal.
Practical Application on NQ and ES
On ES with its deep liquidity, you generally need more consecutive levels for a meaningful stacked imbalance. The ratios need to be higher because the baseline noise is greater. On NQ, stacked imbalances are more frequent and often relevant with just three levels, because thinner liquidity makes individual aggressive orders more visible.
For engulfing patterns, the same principle applies: NQ produces larger and faster delta swings. An engulfing on NQ can happen within seconds, while ES typically needs more time to produce a comparable polarity reversal.
My workflow looks like this: I first identify relevant levels through the volume profile and higher timeframe context. When price reaches one of these levels, I watch the footprint for stacked imbalances as the first sign of urgency. And when price actually turns, I want to see an engulfing as confirmation. Only the combination of level, imbalance, and momentum shift gives me the confidence to take a trade.
When you see a failed structure at a key level, and the footprint shows a stacked imbalance followed by an engulfing in the opposite direction, that is one of the highest-conviction setups in order flow trading. The structure failure provides the macro context, the stacked imbalance shows the aggressive attempt, and the engulfing confirms the rejection.
FAQ
How many levels does a stacked imbalance need at minimum?
The general definition requires three or more consecutive levels. In practice, the significance depends on the instrument's liquidity. On ES, you typically need more levels than on NQ because the baseline noise is higher. What matters is not the exact number but the visual clarity of the diagonal signature on the footprint.
Can I use stacked imbalances as standalone entry signals?
No. Stacked imbalances show urgency at a price level, but they do not tell you whether that urgency is sustainable. Without the context of absorptions, CVD trend, and market structure, you are essentially making a coin-flip decision. Stacked imbalances are confirmation signals, not entry signals.
What is the difference between an order flow engulfing and a candlestick engulfing?
A candlestick engulfing refers to the price range: the second candle completely envelops the first. An order flow engulfing refers to delta and volume: the second bar completely reverses the aggressive direction of the first. You can have an order flow engulfing without a classic candlestick engulfing, and vice versa. The order flow version is the more informative signal because it shows you what actually happened at the exchange level.
In our mentoring program, you'll learn these concepts in over 1,500 video lessons with real chart examples.