Trading Treasury Futures: A Day Trader's Guide to Bond Futures
Treasury futures trading gives you direct access to the second most liquid futures market in the world, right behind the E-mini S&P 500. If you trade equity index futures like NQ or ES without watching bonds, you are missing the single most important piece of real-time macro context available. Bond futures tell you what institutional money thinks about growth, inflation, and risk before equities react.
Risk Disclaimer: Trading futures and other financial instruments involves significant risk of loss. Past results are not indicative of future performance. Only trade with capital you can afford to lose.
Why Every Day Trader Should Watch Bonds
Most retail traders have never looked at a bond chart. They stare at NQ or ES all day, draw their support and resistance lines, watch their footprint charts, and completely ignore the market that actually drives the price action they are trying to trade. This is one of the biggest blind spots in retail trading.
Bonds Set the Price of Everything
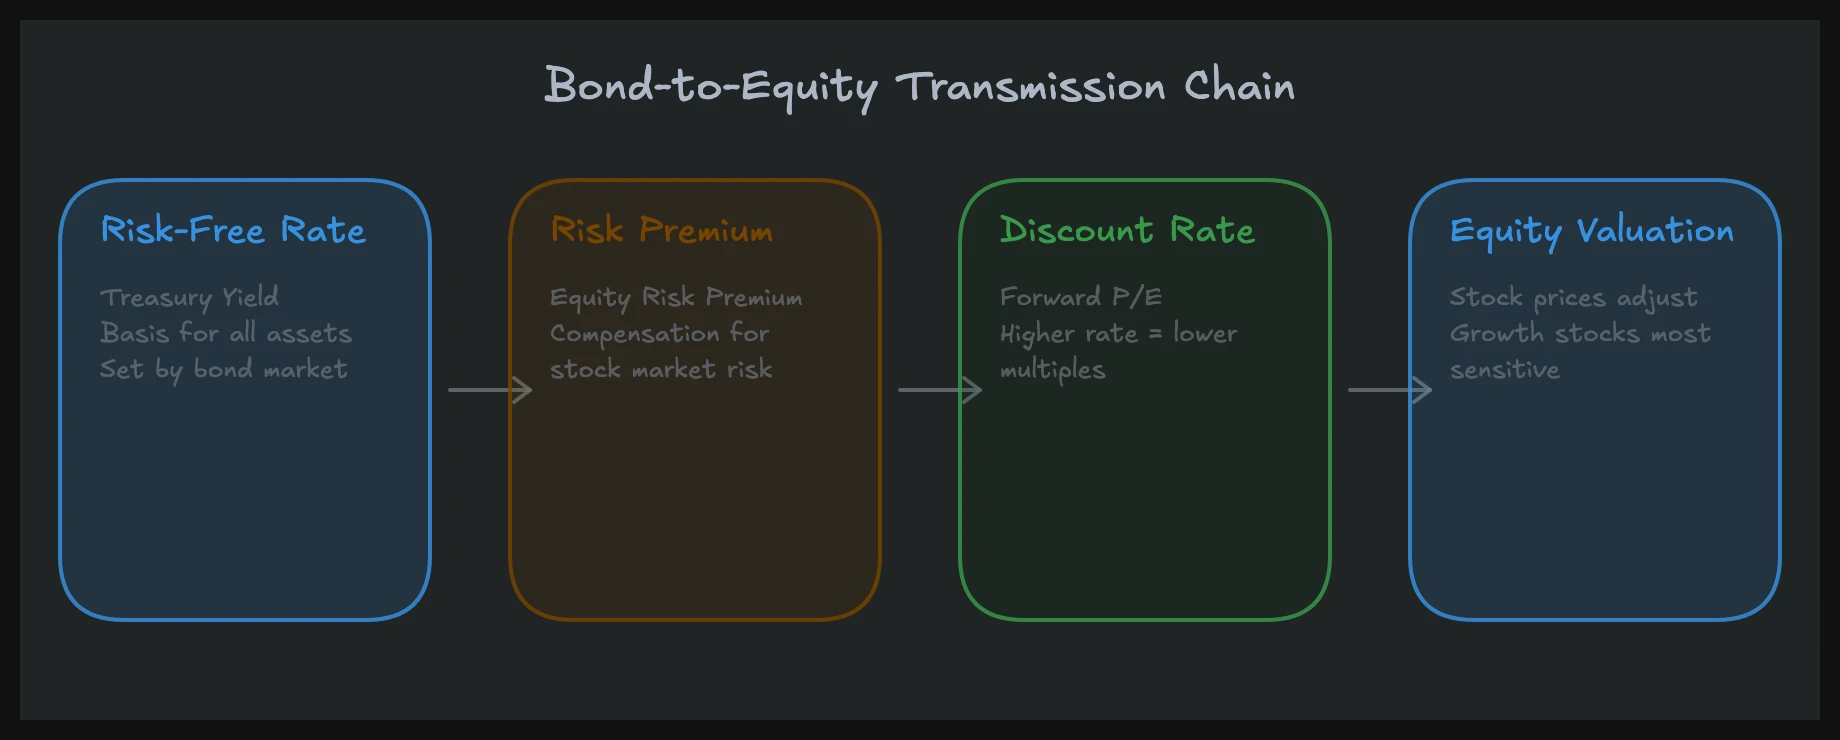
Every financial asset on the planet is priced relative to the risk-free rate. When you buy a stock, you are accepting a risk premium over what you could earn risk-free in government bonds. When the risk-free rate changes, the required return on every other asset changes with it. That is not opinion. That is the foundation of asset pricing.
The 10-year US Treasury yield is the benchmark. Mortgage rates, corporate bond yields, stock valuations, they all derive from it. When the 10-year yield moves 15 basis points in a day, the repricing ripples across every market. Tech stocks with long-duration cash flows (the Nasdaq) are especially sensitive because small changes in discount rates create large changes in present value.
The Transmission to Equities
Here is the chain of events that plays out almost every trading day:
- Economic data comes out (CPI, NFP, FOMC statement)
- Bond traders react first, repricing rate expectations
- Treasury futures move (/ZN, /ZB)
- Equity index futures adjust (NQ, ES)
- Individual stocks follow
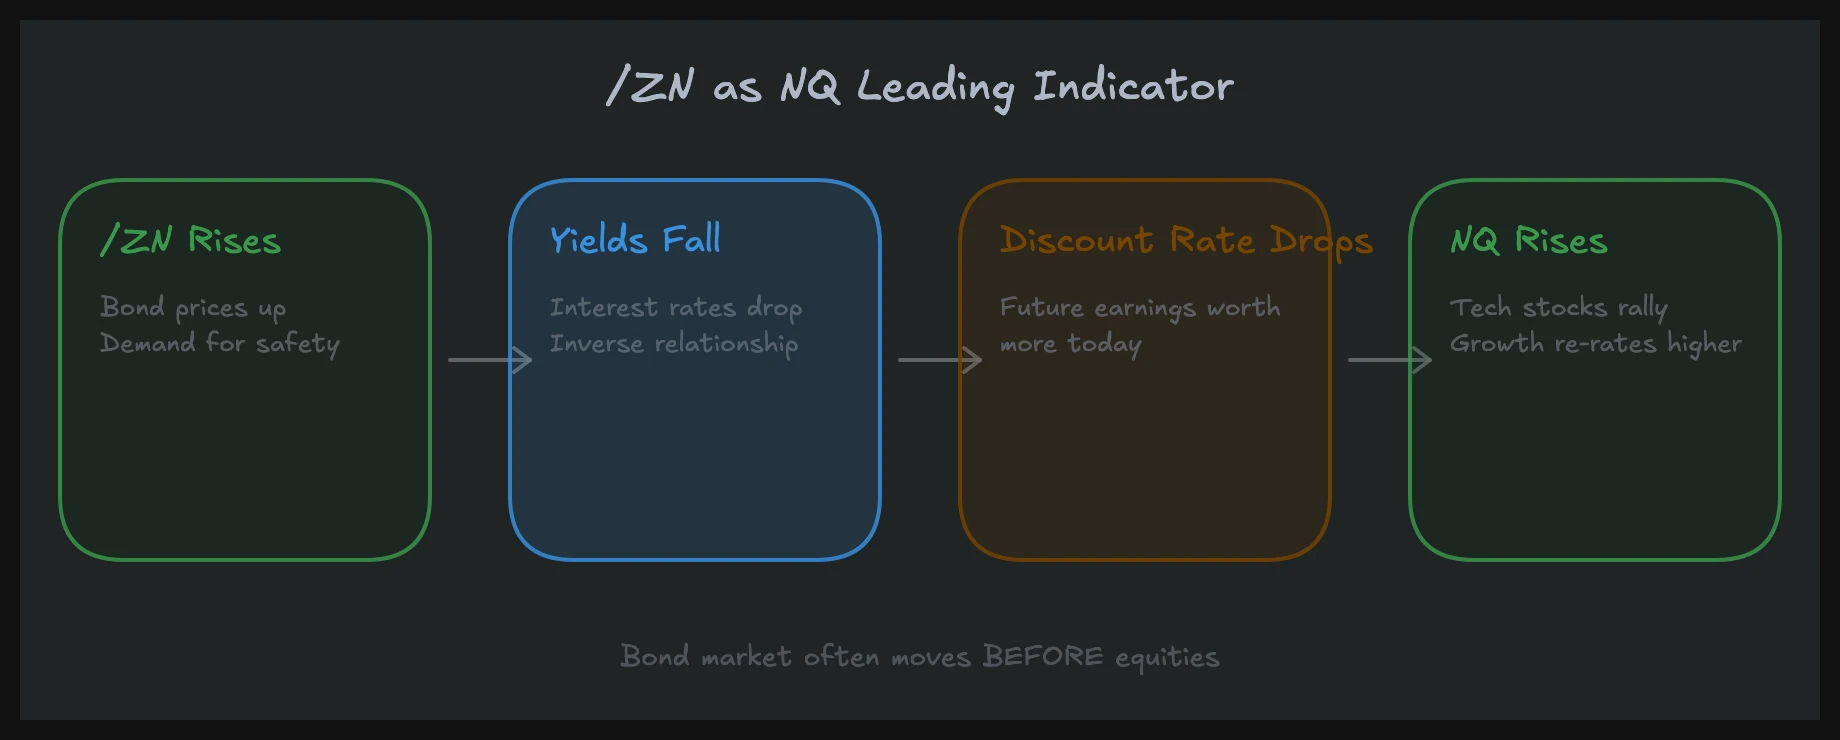
Bonds move first. Always. When I traded at a prop desk, we had the bond screen front and center. Before looking at any equity setup, I checked what bonds were doing. If /ZN was selling off hard, I knew NQ would face headwinds regardless of what the chart pattern said. If /ZN was catching a bid, the environment was favorable for long equity positions.
Why Retail Traders Miss This
The answer is simple: most retail trading education comes from other retail traders who never worked on an institutional desk. They teach chart patterns and indicators because that is what they know. They do not teach intermarket analysis because they never had to use it.
On an institutional desk, you do not get a choice. The bond screen is there whether you want it or not. And after watching bonds and equities move together for thousands of hours, you internalize the relationship. Retail traders who add a bond chart to their screen for the first time consistently report the same thing: "I can suddenly see why NQ did what it did."
Treasury Futures Contracts: What You Need to Know
The CME Group lists several Treasury futures contracts covering different parts of the yield curve. Each contract has different characteristics, and choosing the right one matters for your trading style.
The Core Contracts
| Contract | Symbol | Underlying | Point Value | Tick Size | Tick Value | Avg Daily Volume |
|---|---|---|---|---|---|---|
| 10-Year T-Note | /ZN | 10-Year Treasury Note | $1,000/point | 1/64 | $15.625 | ~1.5M contracts |
| 30-Year T-Bond | /ZB | 30-Year Treasury Bond | $1,000/point | 1/32 | $31.25 | ~300K contracts |
| 5-Year T-Note | /ZF | 5-Year Treasury Note | $1,000/point | 1/128 | $7.8125 | ~1.2M contracts |
| 2-Year T-Note | /ZT | 2-Year Treasury Note | $2,000/point | 1/128 | $15.625 | ~500K contracts |
| Micro 10-Year Yield | /10Y | 10-Year Yield | $10/bp | 0.001 | $1.00 | ~100K contracts |
/ZN: The Workhorse
The 10-Year T-Note future (/ZN) is the contract I recommend for most day traders. It is the most liquid Treasury future with average daily volume exceeding 1.5 million contracts. The bid-ask spread is typically one tick (1/64 of a point, or $15.625 per contract). That tight spread means low transaction costs and reliable fills.
/ZN tracks the 10-year part of the yield curve, which is the most-watched benchmark in global finance. When financial media says "yields are rising," they usually mean the 10-year yield. When the Fed talks about monetary policy transmission, the 10-year is the key metric. For intermarket analysis with equities, /ZN gives you the clearest signal.
A one-point move in /ZN equals $1,000 per contract. Points are quoted in fractions of 32nds (for example, 110'16 means 110 and 16/32 points). The minimum tick is half of 1/32, which is 1/64 of a point ($15.625). On a typical day, /ZN moves 12 to 20 ticks (roughly $187 to $312 per contract). On FOMC days or hot CPI prints, moves of 40 to 60 ticks ($625 to $937) are common.
/ZB: More Volatility, Longer Duration
The 30-Year T-Bond future (/ZB) tracks the long end of the yield curve. Because 30-year bonds have the most duration sensitivity, /ZB moves more than /ZN on any given day. A one-point move is also $1,000, but the minimum tick is 1/32 ($31.25), twice the dollar value of a /ZN tick.
I use /ZB when I want a more aggressive read on bond market sentiment. The long end tends to move more on inflation expectations and term premium shifts. If I see /ZB selling off while /ZN is relatively stable, that tells me the market is repricing long-term inflation, not short-term rate expectations. That distinction matters for equity positioning.
/ZF and /ZT: The Short End
The 5-Year (/ZF) and 2-Year (/ZT) contracts track the shorter end of the yield curve. These are more sensitive to Fed policy expectations. When the market is pricing in rate cuts or hikes, /ZF and /ZT move more than /ZN relative to what the shift means for rates.
For most equity day traders, /ZN is sufficient. But if you want to understand the full picture, watching /ZN alongside /ZF gives you a real-time read on the yield curve slope, something I will cover in the intermarket section below.
Micro Treasury Futures
CME introduced Micro 10-Year Yield futures (/10Y) for traders who want bond market exposure with smaller position sizes. These are quoted directly in yield terms (for example, 4.250 means 4.250% yield), which makes them intuitive. Each basis point move equals $10.
For traders starting out or those who simply want to add a bond position to complement their equity trades, micros are a practical option. The liquidity is not comparable to /ZN, but it is sufficient for small position sizes.
What Moves Treasury Futures
Bond prices respond to a specific set of economic forces. Understanding these drivers is not optional if you trade bonds, and it is extremely valuable even if you only trade equities.
FOMC Decisions and Fed Communication
The Federal Reserve is the single most important driver of short-term bond price action. FOMC rate decisions, the dot plot, press conferences, and Fed speaker appearances all move Treasury futures directly. The market does not just react to what the Fed does. It reacts to what the Fed signals about the future.
When the Fed raises rates, short-term yields rise immediately. Longer-term yields may or may not follow, depending on whether the market believes the hike will slow growth. When the Fed signals future cuts, the entire curve reprices. /ZN can move 30+ ticks on a single FOMC statement if the language surprises the market.
I always reduce my equity position size on FOMC days and watch /ZN for the initial reaction. The bond market's response to Fed communication is faster and cleaner than the equity market's response. You can learn more about trading around these events in our FOMC Trading Strategy guide.
Inflation Data: CPI and PPI
Inflation is the bond market's biggest fear. Higher inflation erodes the real return on fixed-income investments. When CPI or PPI comes in hotter than expected, bond prices drop (yields rise) because investors demand higher compensation for inflation risk.
The reaction is mechanical and fast. A CPI print that beats consensus by 0.2% can push /ZN down 15 to 25 ticks within minutes. The bond market does not wait to analyze the details. The headline number hits, algorithms execute, and prices move. The details get analyzed over the following hours, which can cause reversals if the underlying components tell a different story than the headline.
For equity traders, this matters directly. A hot CPI print that crushes /ZN will hit NQ hard, especially growth and tech names. A cool CPI print that lifts /ZN gives NQ room to rally. Watching /ZN during CPI releases gives you a 30-second to 2-minute lead time on how NQ will react.
Employment Data: NFP and Jobless Claims
Non-Farm Payrolls (NFP) on the first Friday of each month is the second most impactful regular data point for bonds after CPI. Strong employment data suggests the economy is running hot, which may force the Fed to keep rates higher for longer. That pushes bond prices down.
Weak employment data suggests the economy is slowing, which brings rate cut expectations forward. That pushes bond prices up. The relationship is reliable enough that you can almost use /ZN's reaction to NFP as a cheat sheet for what equities will do next.
Weekly jobless claims matter too, though less dramatically. They provide a higher-frequency read on labor market conditions. Consistently rising claims change the narrative, even if no single release is a market mover.
Treasury Auctions
The US Treasury regularly auctions new debt. The results of these auctions, particularly for 10-year notes and 30-year bonds, can move Treasury futures significantly. The key metrics are:
- Bid-to-cover ratio: How much demand exists relative to supply. A ratio above 2.5 is generally considered strong.
- Tail: The difference between the auction yield and the pre-auction when-issued yield. A large tail means weak demand (the Treasury had to offer a higher yield to attract buyers).
- Indirect bidders: A proxy for foreign central bank demand. Higher indirect participation signals strong overseas demand.
A poorly received auction (large tail, low bid-to-cover) tells you that the market is struggling to absorb Treasury supply at current yields. That pushes prices down and yields up. It is a structural signal, not just a momentary blip.
Risk Sentiment and Flight to Safety
During market stress, money flows from risky assets (stocks) into safe assets (Treasuries). This "flight to quality" pushes bond prices up and yields down. The reverse happens during risk-on environments: money leaves bonds and flows into equities.
This is why bonds and stocks often show negative correlation during crises. In March 2020, as equities crashed, /ZN surged. In 2022, that relationship broke down because inflation forced the Fed to hike aggressively, pushing both stocks and bonds down simultaneously. Understanding when the correlation holds and when it breaks is one of the most valuable skills in intermarket analysis.
The Inverse Relationship: Price vs. Yield
This is the concept that trips up most beginners, so I want to make it completely clear.
The Mechanics
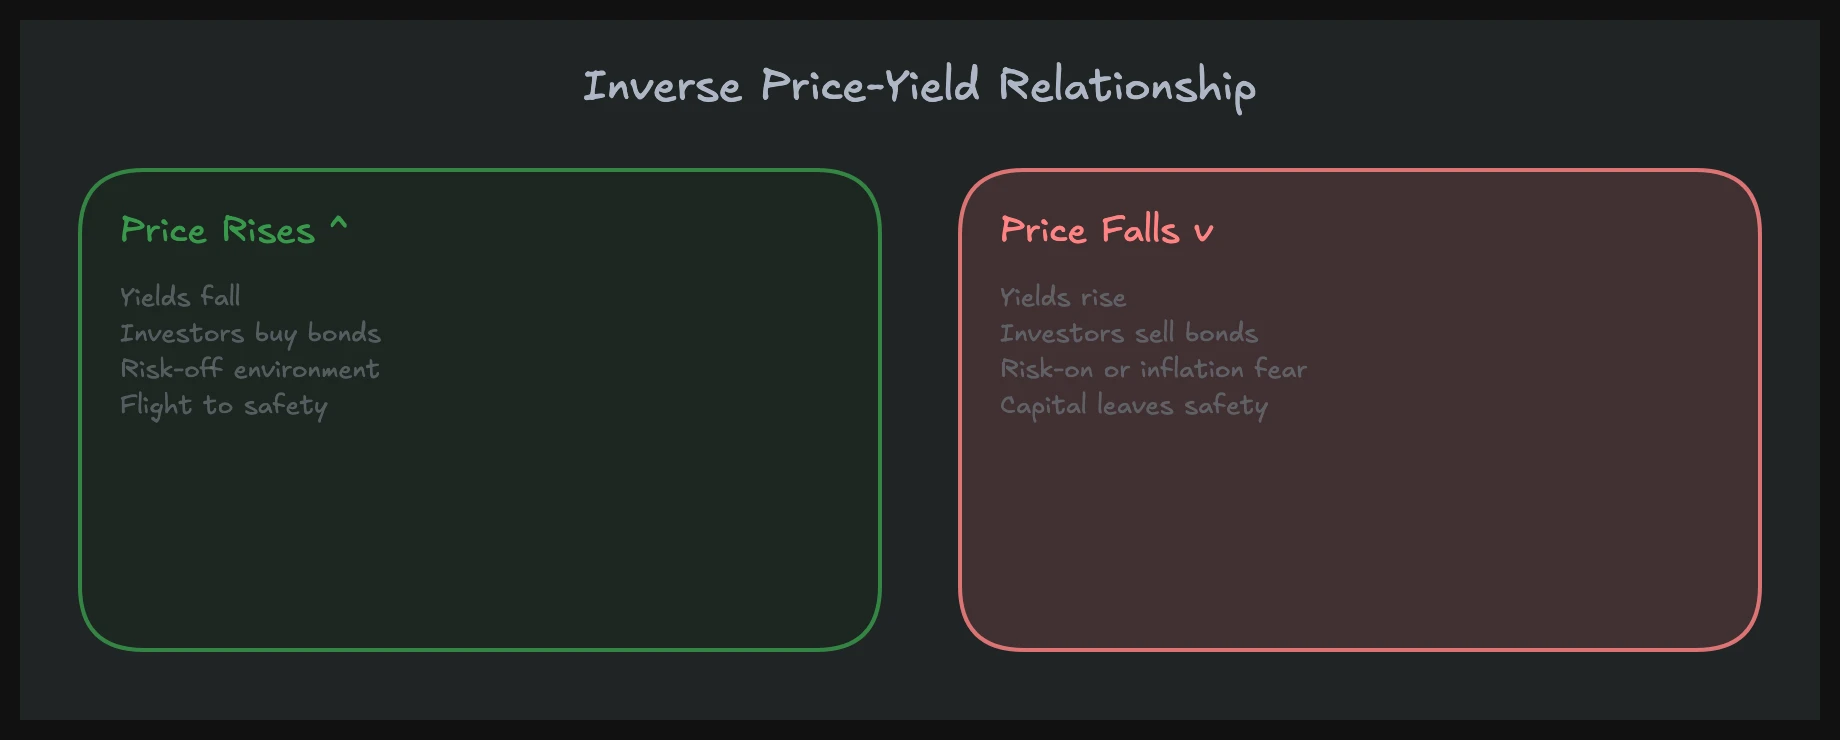
When you see /ZN on your chart, you are looking at the price of a Treasury note future. When the price goes up, yields go down. When the price goes down, yields go up. Always. Without exception.
The logic is straightforward. A bond pays a fixed coupon. If you buy the bond at a higher price, your effective return (yield) on that purchase is lower because you paid more for the same coupon. If you buy it at a lower price, your yield is higher.
Example: A 10-year note with a 4% coupon priced at par (100) yields 4%. If the price drops to 97, the yield rises to roughly 4.33% because you are getting the same $4 annual coupon on a $97 investment. If the price rises to 103, the yield drops to roughly 3.69%.
Why This Matters for Your Trading
When someone says "yields are rising," that means bond prices are falling. /ZN is going down. That typically means headwinds for equities, especially growth stocks and NQ.
When "yields are falling," bond prices are rising. /ZN is going up. That typically means tailwinds for equities.
I keep it simple on my screen: /ZN green candle = good for NQ. /ZN red candle = watch out for NQ. This is a simplification, and there are exceptions (which I cover in the intermarket section), but as a first filter it works remarkably well.
Reading Bond Futures Quotes
Treasury futures use a unique quoting convention. A /ZN quote of 110'165 means:
- 110 = handle (full points)
- 16 = 16/32nds of a point
- 5 = half of 1/32 (so 16.5/32nds total)
This equals 110 + 16.5/32 = 110.515625 in decimal. Each 1/32 ($31.25) contains two ticks of 1/64 ($15.625 each). It feels awkward at first, but after a few days of watching the tape, it becomes second nature.
/ZN as a Real-Time NQ Indicator
This section is where treasury futures trading moves from "nice to know" to "directly profitable." The relationship between /ZN and NQ is one of the most reliable intermarket signals available to day traders.
The Signal
The basic framework:
- /ZN selling off (yields rising): NQ faces headwinds. Long setups in NQ have lower probability. Short setups get a tailwind.
- /ZN rallying (yields falling): NQ gets a bid. Long setups in NQ have higher probability. Short setups fight the macro flow.
- /ZN flat: Bonds are not a factor. Trade NQ on its own merit.
This does not mean NQ blindly follows /ZN tick for tick. It means that /ZN provides context for your NQ setups. A perfect-looking long setup in NQ while /ZN is in free-fall is a lower-probability trade than the same setup with /ZN stable or rising.
How to Use It Practically
Here is my workflow for incorporating /ZN into equity index trading:
- Pre-market: Check /ZN overnight range and direction. If /ZN sold off overnight, expect NQ to open with some pressure. If /ZN rallied, NQ has room.
- At the open: Watch the first 15 minutes of /ZN alongside NQ. Are they moving together (bonds up, NQ up)? Or diverging? Divergence is a warning sign.
- Around data releases: Watch /ZN's reaction to economic data before making NQ trades. /ZN reacts faster and cleaner.
- During the session: If /ZN suddenly reverses direction, pay attention. Something changed in the macro narrative. That shift will eventually hit NQ.
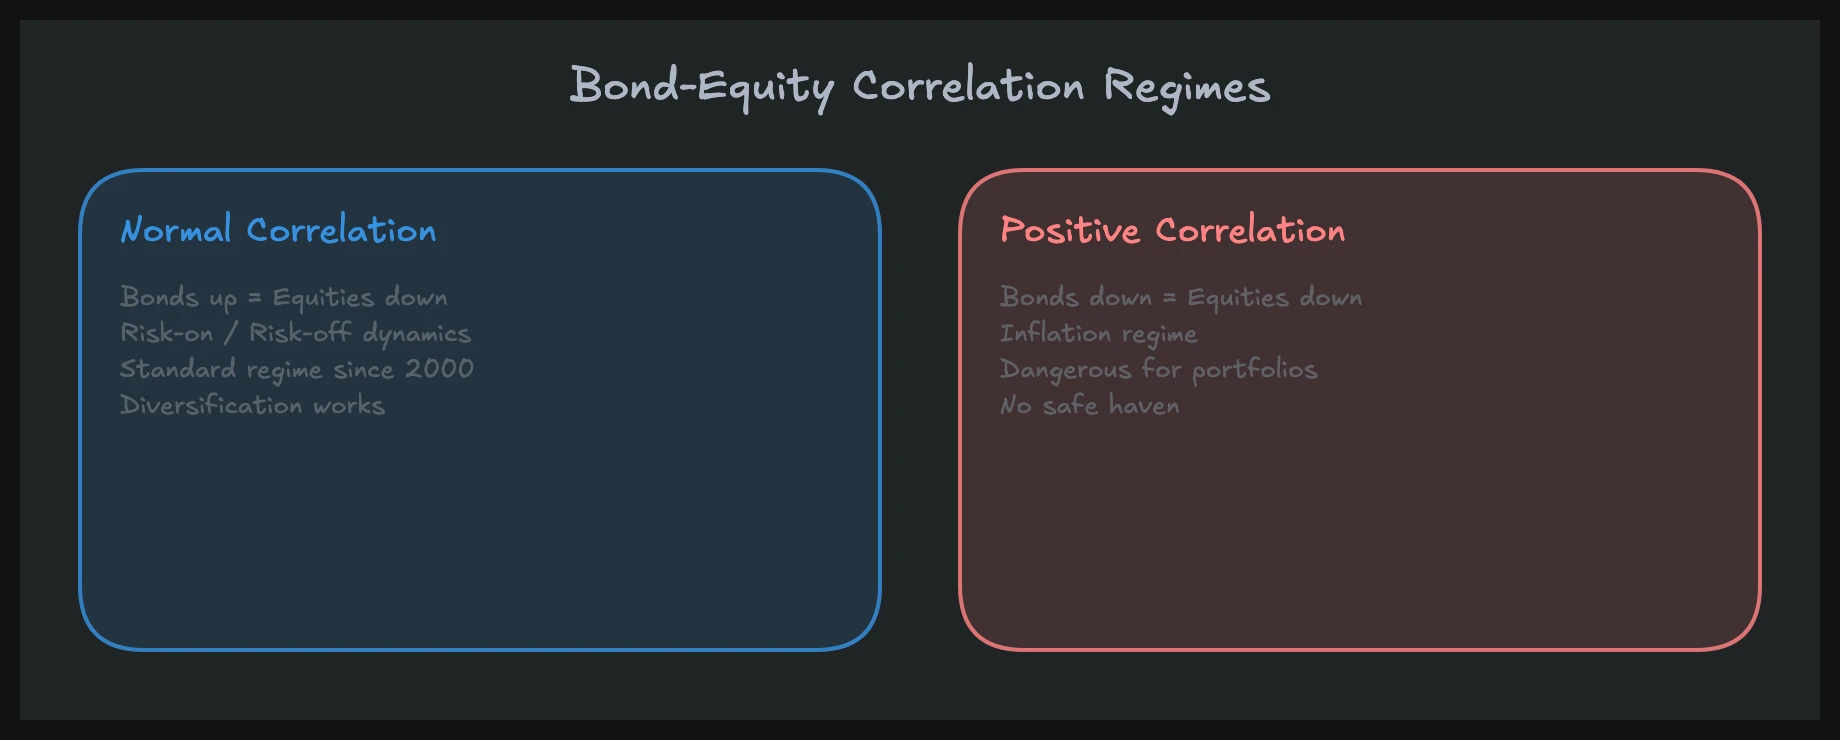
When the Correlation Breaks
The bond-equity negative correlation (bonds up = stocks up) is the normal regime, but it is not permanent. In environments where inflation is the dominant concern, bonds and stocks can sell off together. This happened throughout much of 2022.
The key question is: What is the market worried about? If the concern is growth (recession fears), the traditional correlation holds. Bonds rally as a safe haven while stocks sell off. If the concern is inflation, both get hit because higher rates hurt both bond prices and stock valuations simultaneously.
Understanding which regime you are in changes everything about how you use /ZN as an equity indicator. In a growth-concern regime, /ZN selling off actually supports NQ (yields falling, risk-on). In an inflation-concern regime, /ZN selling off is bad for NQ (yields rising, tightening financial conditions).
Intermarket Analysis: Bonds, Equities, and the Yield Curve
Going beyond the simple /ZN-to-NQ signal, treasury futures give you access to a deeper layer of macro analysis through the yield curve.
What the Yield Curve Tells You
The yield curve plots the yield of Treasury securities across different maturities. In a normal environment, longer-term bonds yield more than shorter-term bonds (the curve slopes upward). When this relationship changes, it signals something important about economic expectations.
- Steepening curve (/ZN underperforming /ZF): The market expects stronger growth or higher inflation ahead. Long-term rates are rising faster than short-term rates.
- Flattening curve (/ZN outperforming /ZF): The market expects slower growth. Short-term rates are high (Fed tightening), but long-term rates are not keeping up because the market thinks the economy will slow.
- Inverted curve (short-term yields above long-term yields): Historically one of the most reliable recession indicators. The market is saying: "The Fed is too tight and will have to cut."
You can track this in real time by watching the spread between /ZN and /ZF or between /ZN and /ZT. When that spread changes direction, something meaningful is happening in macro expectations.
Bond/Equity Correlation Shifts
Over the last 25 years, the correlation between bonds and stocks has shifted between regimes:
| Period | Regime | Correlation | Driver |
|---|---|---|---|
| 2000-2021 | Deflationary fears | Negative (bonds up, stocks down) | Low inflation, growth concerns |
| 2022 | Inflation shock | Positive (both down together) | Aggressive Fed tightening |
| 2023-2024 | Transition | Mixed | Disinflation + resilient growth |
| 2025-present | Normalization | Mostly negative | Growth sensitivity returns |
Tracking which regime you are in is not difficult. Ask yourself: "Is the market more worried about inflation or growth?" If inflation is the headline, expect positive correlation (bad for bonds = bad for stocks). If growth is the headline, expect negative correlation (bad for stocks = good for bonds as safe haven).
Using Bonds for Position Sizing
One practical application I use daily: adjusting my NQ position size based on bond market behavior.
If /ZN is moving in a direction that supports my NQ trade, I take full size. If /ZN is neutral, I take standard size. If /ZN is moving against my NQ thesis, I reduce size or skip the trade entirely. This is not a mechanical rule but a contextual filter. It has kept me out of more bad trades than any single indicator.
Combining order flow analysis with bond market context gives you both the micro and macro picture. Order flow tells you what is happening right now in the instrument you are trading. Bonds tell you whether the macro environment supports that move continuing.
How to Start Trading Treasury Futures
If you have been trading equity index futures and want to add bonds to your toolkit, here is a practical starting point.
Step 1: Add /ZN to Your Screen
You do not need to trade bonds to benefit from them. Start by simply adding a /ZN chart next to your NQ or ES chart. Watch them side by side for two weeks. You will start seeing the relationship without anyone explaining it to you.
Step 2: Learn the Contract Specs
Before placing a single bond trade, understand the contract you are dealing with. /ZN has a point value of $1,000, minimum tick of $15.625, and margin requirements that vary by broker (typically $1,200 to $2,000 for day trading). This is a professional market with professional participants.
Step 3: Watch Economic Calendar Events
Pay special attention to how /ZN reacts to CPI, NFP, FOMC, and Treasury auctions. Take notes. After a few months, you will develop an intuitive sense for how bonds respond to different types of economic data.
Step 4: Start Small
If you want to actively trade bonds, start with micro contracts (/10Y) or single /ZN contracts. Bond futures move differently than equity futures. The pace is slower on most days, but the moves around data releases are sharp and fast. Give yourself time to develop a feel for the rhythm.
Step 5: Integrate, Do Not Replace
The goal is not to abandon NQ trading and become a bond trader. The goal is to use bonds as context for your existing trading. The best equity trades happen when your setup, your order flow reading, and the bond market all align in the same direction.
Frequently Asked Questions
What Are Treasury Futures?
Treasury futures are standardized contracts traded on the CME that derive their value from US government bonds. The most common contracts are /ZN (10-year), /ZB (30-year), and /ZF (5-year). They allow traders to speculate on or hedge against changes in interest rates without owning the underlying bonds. With daily volume exceeding 4 million contracts combined, they are among the most liquid futures markets in the world.
How Do Bonds Affect Stocks?
Bonds affect stocks through the discount rate mechanism. Every stock is theoretically worth the present value of its future cash flows, discounted at the risk-free rate plus a risk premium. When bond yields rise (bond prices fall), the discount rate increases, and stock valuations decline, especially for growth and tech stocks with cash flows far in the future. This is why NQ (Nasdaq futures) is particularly sensitive to bond market moves.
Can Retail Traders Trade Treasury Futures?
Yes. Any futures broker that offers equity index futures also offers Treasury futures. The margin requirements are moderate (/ZN typically requires $1,200 to $2,000 for intraday trading), and the liquidity is exceptional. Micro Treasury futures (/10Y) are available for traders who want smaller exposure. The barrier to entry is not access. It is knowledge, and that is what this guide addresses.
What Is the Best Treasury Future for Day Trading?
/ZN (10-Year T-Note) is the best starting point for most day traders. It offers the highest liquidity, the tightest spreads, and tracks the most-watched benchmark in global rates. /ZB (30-Year) is an alternative for traders who want more volatility, but the wider spreads and lower volume make execution less forgiving. Start with /ZN and expand from there.
How Do I Read Treasury Futures Prices?
Treasury futures are quoted in points and 32nds. A price of 110'16 means 110 and 16/32 points ($110,500 notional value for /ZN). The smallest tick for /ZN is half of 1/32 (1/64 of a point), which equals $15.625. Price movement is inverse to yields: when /ZN goes up, yields are falling, and when /ZN goes down, yields are rising.
In our mentoring program, you will learn how bonds, interest rates, and economic data connect across 20 video lessons in the macroeconomics course. We cover the exact transmission mechanisms from the bond market to equity futures, with live examples showing how to read /ZN alongside NQ for real-time trading context.