Order Flow Trading: What Really Moves the Market
Order flow trading is the analysis of actual buy and sell orders to understand who is moving the market right now. Instead of reacting to indicators or chart patterns, you directly observe how aggressive market orders hit passive limit orders. This is not secret knowledge: institutional traders have been using order flow as their primary tool for decades.
Risk Warning: Trading futures and other financial instruments carries significant risk of loss. Past performance is not indicative of future results. Only trade with capital you can afford to lose.
What Most Traders Do Wrong
The biggest danger for traders who want to learn order flow trading is not lack of knowledge. It is half-knowledge. You may know the terms, have watched some YouTube videos about Footprint Charts, and can tell delta from volume. But between knowing the terms and understanding order flow lies a gap that most people never cross.
Why Retail Traders Learn Order Flow Wrong
In the futures market, hedge funds, market makers, pension funds, and other institutional traders dominate trading volume. Retail traders make up only a small share. These institutions move the market. Concepts and systems that originated within the small retail bubble have little to do with the reality of institutional markets.
The problem starts with the basics. Many retail traders believe that market open is the most important moment of the day. In reality, the close is what matters for institutional players. Why? Because investment funds and other institutional portfolios are valued daily at the close (Net Asset Value). The closing price is the benchmark.
Another example: retail traders learn "green delta = buyers winning, red delta = sellers winning." This simplification completely ignores context. A strongly positive delta at a resistance level where price still won't rise tells a completely different story than the same delta in an ongoing uptrend. Without context, delta is just a number. With context, it becomes information.
Knowing Tools vs. Understanding Order Flow
Many traders confuse mastering software with understanding order flow. They can operate ATAS, know the buttons in Sierra Chart, or have Bookmap installed. But when they look at the screen, they only see numbers and colors, not context.
Order flow fundamentally consists of the interaction between passive and aggressive orders: Bid, Ask, Market Buy, Market Sell, Limit Buy and Limit Sell. That's it. Every display, every indicator, every tool builds on these building blocks. If you don't understand these elements and their interactions, no software in the world will help you.
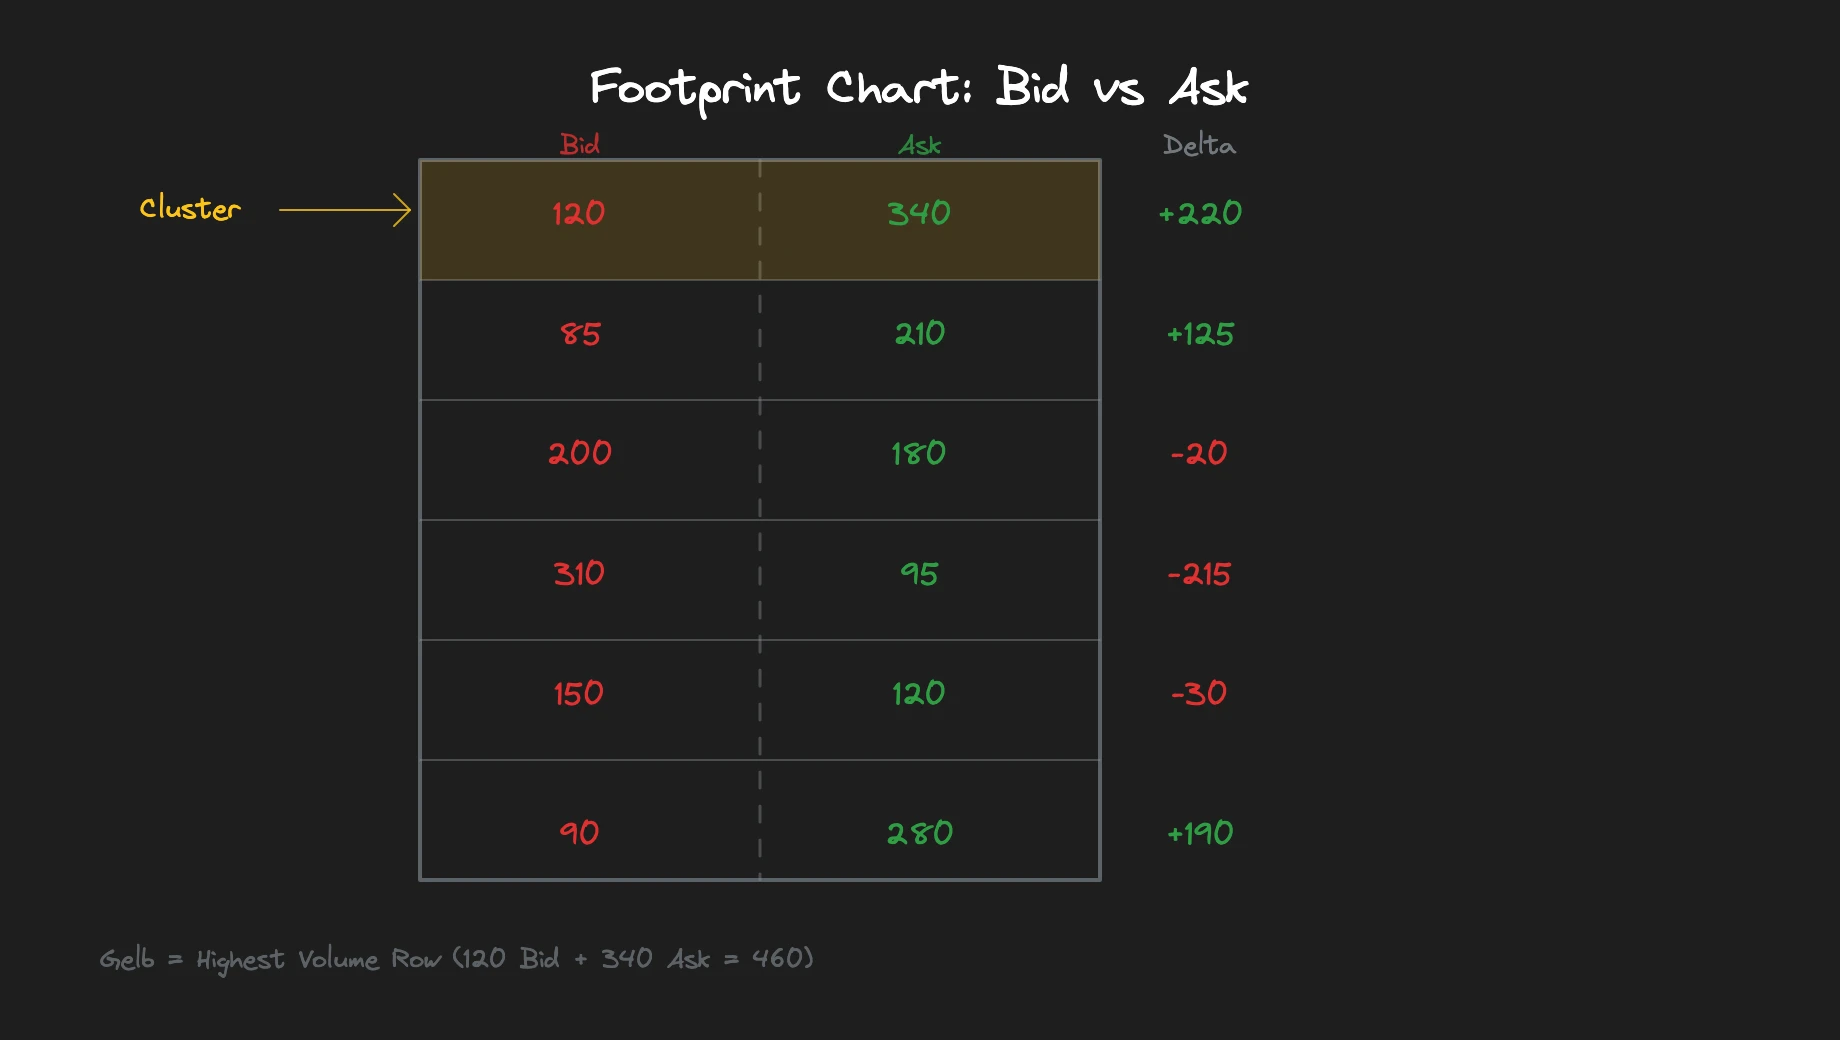
A concrete example: you see in the Footprint Chart a cluster with 500 contracts on the Ask side and 200 on the Bid side. Many retail traders immediately interpret this as "buyers dominate." But what if price drops afterward? Then these 500 market buys fought against limit sells and lost. The limit side held. That's absorption, not a buying signal. Anyone who only sees the numbers but doesn't understand the mechanism draws the wrong conclusion.
What Order Flow Really Is
Order flow is the direct interaction between buyers and sellers at the exchange. There are two extremes in the trading industry: some say order flow is useless. Others overload it with endless interpretations and indicators. Both are wrong. Order flow is neither magic nor nonsense. It is simply what actually happens when a trade is executed.
During my time as an institutional trader, we had exactly two tools on the desk: the order book and the tape. Those are order flow tools. There were no moving averages, no RSI divergences, no Elliott waves. Only who is buying, who is selling, and at what price.
Why Institutional Traders Use Order Flow
Institutional traders don't use order flow as one of many tools. It is their primary tool. On an institutional desk, you see the Level 2 order book, the tape (Time & Sales), and the chart. The chart only shows what was. The order book shows what might come. The tape shows what is happening right now.
The core logic is simple: market orders are always the aggressor. Limit orders are always passive. A market buy tries to push price up. The critical question is: what happens when the aggressive side fails?
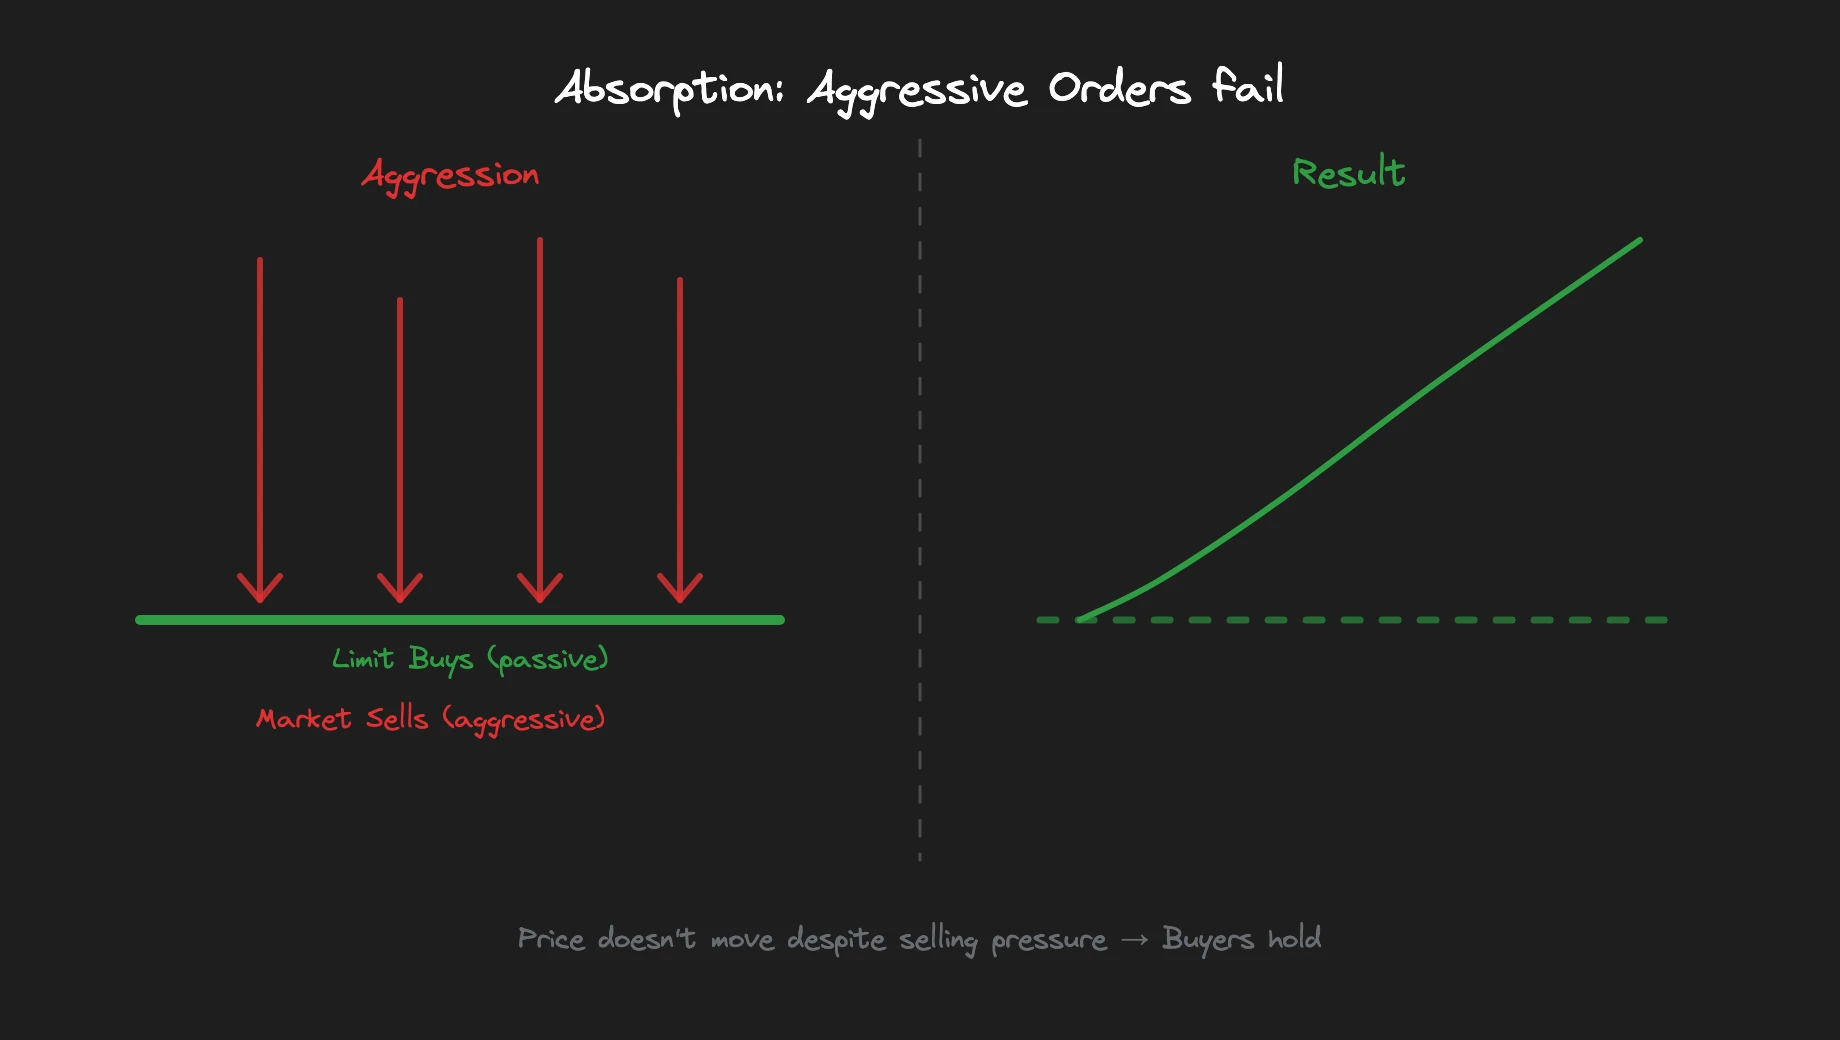
If market buys cannot move price up, even though they constantly hit the Ask side, then limit sells are absorbing this aggression. That's the moment when professional traders pay attention. One side pushes, the other holds. Whoever holds wins.
Possibilities vs. Actualities
This is where it gets really interesting for most traders. What you see in the order book are limit orders, which are declarations of intent. These orders can be deleted or moved at any time. What you see in the tape are executed trades, which are facts.
Visible liquidity (limit orders in the Level 2 feed) shows you where market participants are willing to buy or sell. But stop-loss orders and stop-market orders do not appear in the Level 2 feed. They are invisible because they are conditional orders that only become active when a certain price level is reached. You can only deduce them through logical thinking: if the market has formed a clean sideways range, there are probably stop-losses just above and below that range.
The difference between professionals and amateurs is exactly this: retail traders say "there must be stops there, so I'm going in now." Professional traders say "there could be stops there, so I'm waiting for a reaction." Only when price has reached the level and you see confirmation in the tape or footprint are you allowed to act.
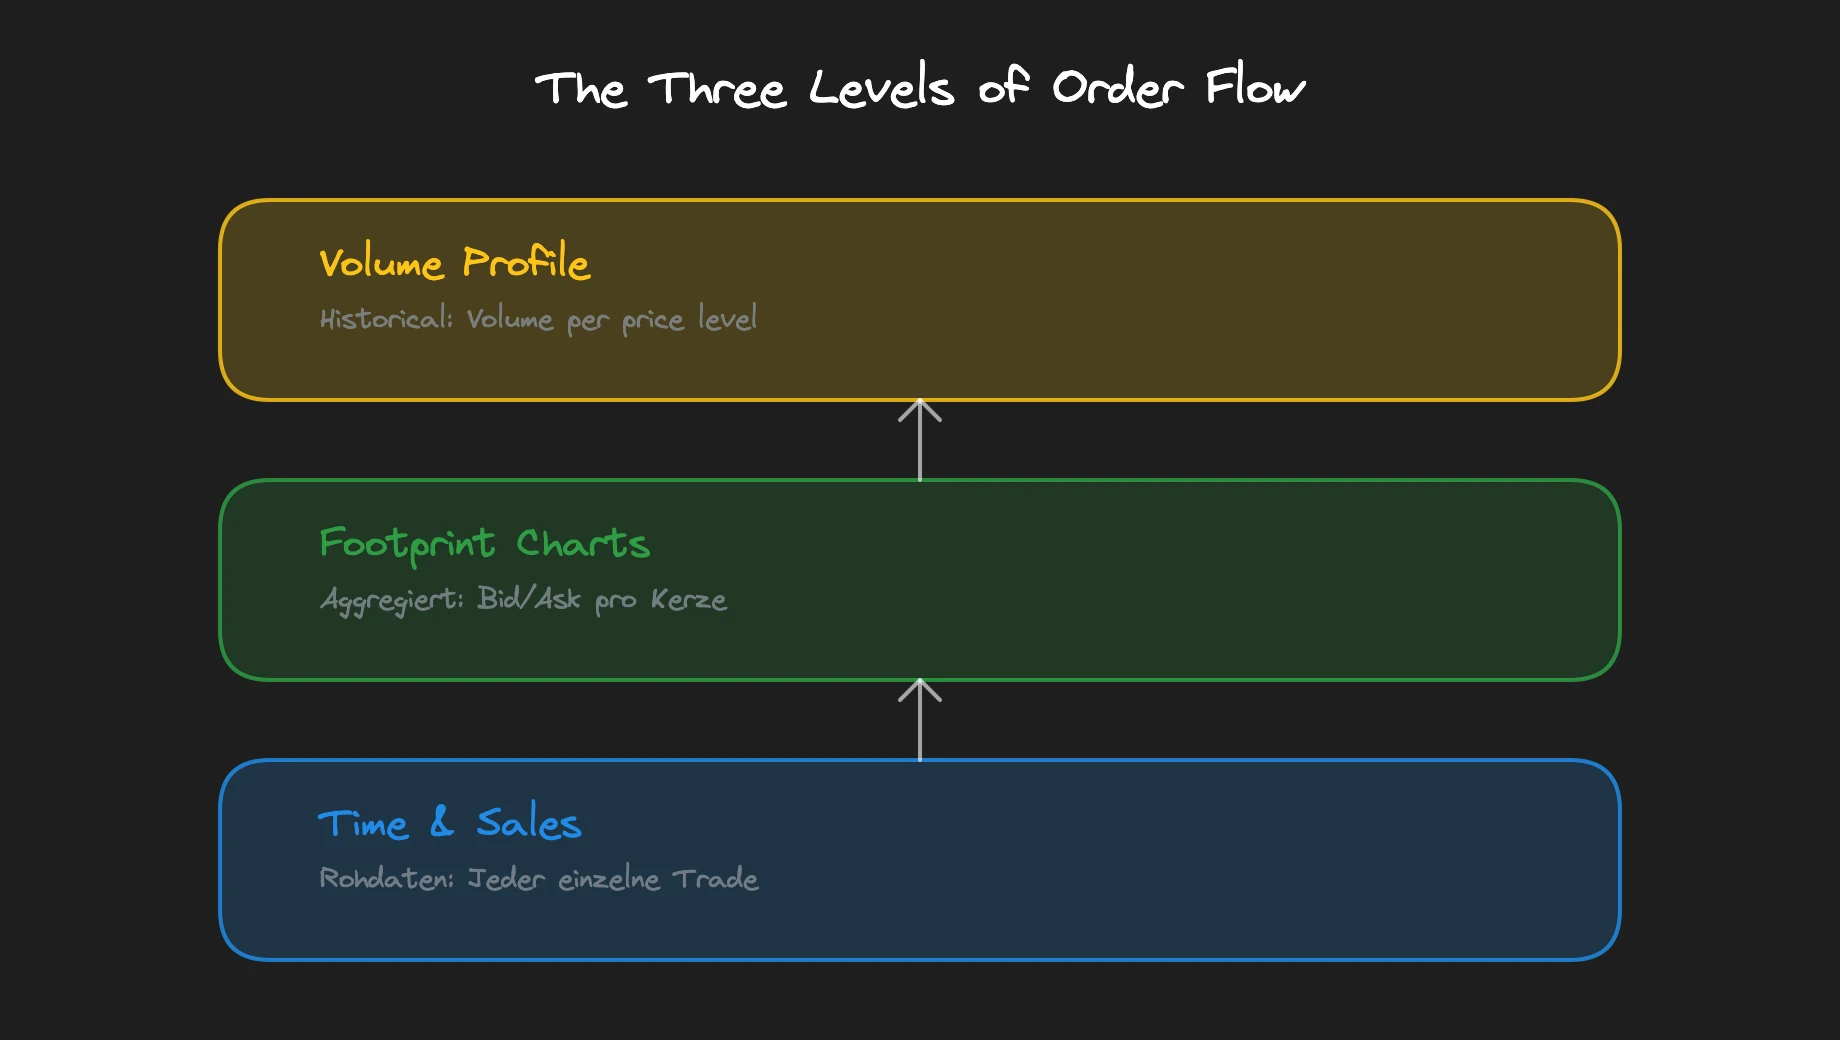
The Three Levels of Order Flow
Order flow can be divided into three levels of representation. Each level aggregates the raw data differently and answers different questions. All three together give you a complete picture.
Time & Sales: The Raw Order Flow
Time & Sales (the "tape") shows you every single executed trade in real time: timestamp, price, volume, and whether the trade occurred on the Bid or Ask side. That is the unfiltered truth of the market. No indicator, no interpretation, just facts.
The problem: in the NQ (Nasdaq-100 futures), hundreds of trades per second flow through the tape. No human can process that in real time. That is why Time & Sales alone is not a practical trading tool for most traders. But it is the foundation on which everything else builds.
Nevertheless, it pays to understand the tape. If you suddenly see a single trade with unusually high volume go through while the average is much lower, that is a signal. Someone just placed a large market order. The question is: was that an algorithm working a position or an emotional reaction? The tape alone doesn't give you the answer, but it shows you where to look deeper.
Footprint Charts: The Aggregated Flow
Footprint Charts (as displayed in ATAS, Sierra Chart, or other platforms) take the raw data from Time & Sales and aggregate it per candle. You see for each price level how many contracts were traded on the Bid side and how many on the Ask side.
The delta (Ask volume minus Bid volume) shows you at a glance which side dominated in a particular candle. Clusters with extreme delta at certain price levels indicate institutional activity.
What makes Footprint Charts so valuable compared to normal candlesticks? A normal chart shows you Open, High, Low, Close and volume. The footprint additionally shows you at which price level within the candle the most activity occurred, whether buyers or sellers dominated, and exactly where the battle took place. You don't just see the result (the finished candle), but the process that led to it.
In our Bootcamp, we dedicate 18 lessons to the Footprint Deep Dive alone, because the depth of interpretation goes far beyond "green = buyers, red = sellers."
If you want to go deeper into Footprint Chart interpretation, our guide on how to read Footprint Charts has the most important patterns and practical examples.
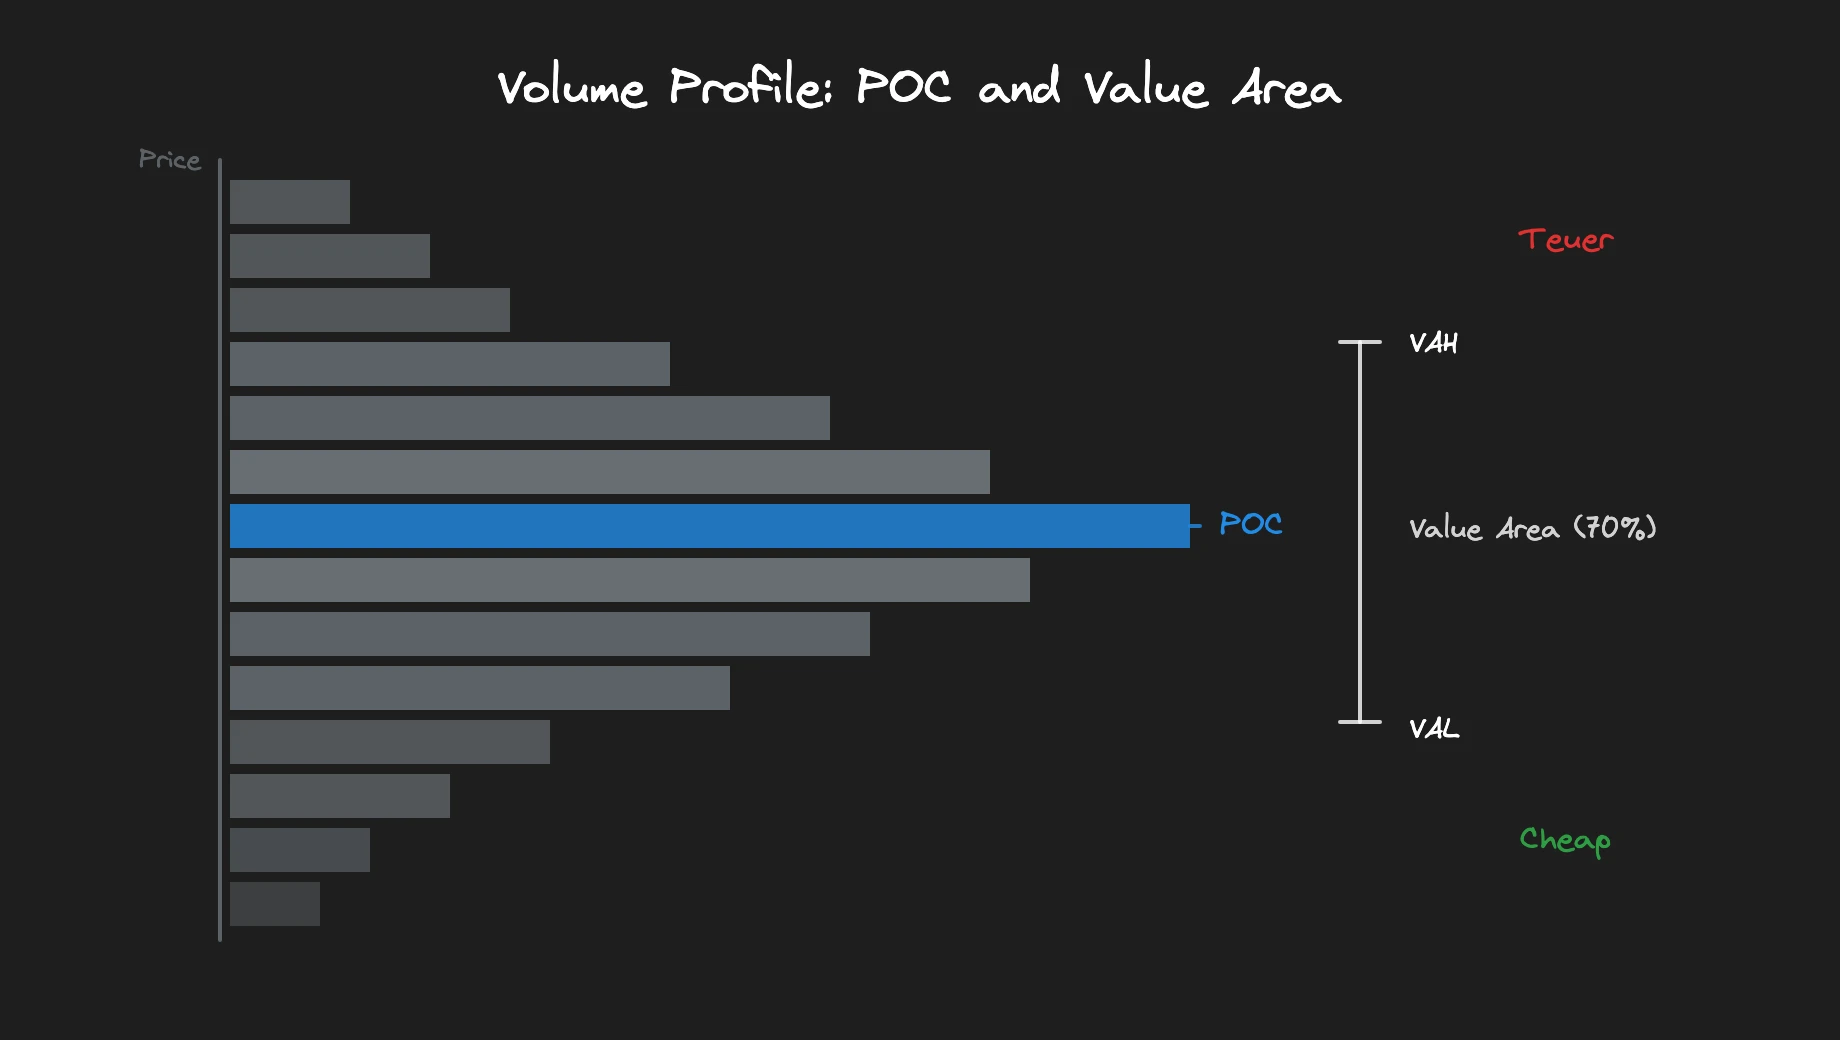
Volume Profile: The Historical Flow
The Volume Profile shows you at which prices the most volume was traded over a certain period. The most important elements:
- POC (Point of Control): The price with the highest trading volume, the "fair price" of a period
- Value Area (VA): The price range where approximately 70% of total volume was traded
- Value Area High / Low: The upper and lower boundaries of the Value Area
Why is this relevant? As an institutional trader, I was measured on whether my average execution price was within the Value Area. If price fell below the Value Area Low, I bought aggressively ("loading the boat"). The further price rose above the fair value, the less I bought. This behavior creates the patterns you see in the Volume Profile.
Retail traders often treat Value Area High, Low and POC as mechanical reversal signals. That is wrong. The correct interpretation: look for volume events and liquidity events at these levels, not blind fading. A POC level from yesterday is not a support or resistance level. It is an information point that tells you where the market found the most consensus yesterday. What happens there today depends on the current context.
The combination of Volume Profile and Footprint Chart is particularly insightful: the Profile shows you where the relevant price levels are. The Footprint shows you in real time what is happening at those levels. Together they give you a depth of information that no other analysis tool can offer.
You can find a detailed guide on Volume Profile in Trading in our separate guide.
How Large Market Participants Absorb Liquidity
Absorption is the central concept in order flow trading. Absorption occurs when aggressive market orders hit a wall of limit orders and price doesn't move despite the pressure. The aggressor fails, the passive participant holds.
Important: absorption can only happen if market orders are actually actively pushing against the limit side. A large limit order that simply sits in the order book and doesn't get hit is not absorption. The aggressive side must be present and active.
The counterpart to absorption is exhaustion. Here too movement stops, but for a completely different reason: not because the other side holds, but because the aggressive side is running out of participants. The drive dies, not because it hits resistance, but because the fuel is missing.
This distinction is critical for your trading decision. In absorption, you expect a counter-movement. In exhaustion, you first expect consolidation. Both look similar on the chart, but in order flow you can recognize the difference.
How to identify large institutional trades and distinguish them from normal market activity is a separate topic we cover in another article.
Visible vs. Invisible Liquidity
If you have a Level 2 data connection and use the right software (e.g., Bookmap), you can see the limit orders in the market. That is visible liquidity. Professional traders work predominantly with limit orders because market orders always pay the spread.
The invisible side is stop-losses and stop-market orders. These are not transmitted through the Level 2 feed. You can only deduce them, never see them directly. This makes them the preferred target of institutional campaigns.
Example: the ES (S&P 500 futures) has formed a tight range between 5,200 and 5,215 for two hours. You know that below 5,200 there are stop-losses for long positions and above 5,215 stop-losses for short positions. But you don't know how many. You don't know if they are still there. You don't know if price will even go there. This uncertainty is why you wait for confirmation, not trade on speculation.
If you want to understand why stops are at predictable levels and how institutional traders use this liquidity, read our article on stop runs and liquidity.
How Institutional Campaigns Form
Large market participants don't enter their positions with a single click. They work an order over hours or days, often using VWAP or TWAP algorithms that distribute volume throughout the day. This campaign of buying or selling creates the structural market movements that retail traders try to follow.
The principle: institutions have to trade. They can't just stop. A pension fund that needs to build a large position in the S&P cannot do it in a single order. They run a campaign over days, sometimes weeks: buying aggressively at low prices (relative to VWAP or the Value Area), buying progressively less as prices rise, waiting or even taking some profits at high prices.
This recurring behavioral pattern is visible in the Volume Profile and observable in real time in order flow. You don't see the campaign as a whole (no retail trader sees the complete picture), but you see the individual footprints: unusually large limit orders at certain levels, recurring absorption at the same price levels, aggressive buying in the tape at every pullback to the Value Area Low.
The Limits of Order Flow Trading
Order flow trading has clear limits, and anyone who doesn't know them will lose money. Many providers sell order flow as the holy grail. We honestly tell you where it stops working.
The Noise Problem
When you observe raw order flow, especially in the NQ, you see a constant battle between buyers and sellers on every single tick. It switches so fast your brain can't keep up. Without a higher-level framework, every tick simultaneously generates potential buy and sell signals.
There's also spoofing: market participants deliberately place large limit orders they delete fractions of a second later to lure other participants in the wrong direction. Spoofing has been illegal in the USA since the Dodd-Frank Act of 2010 and is prosecuted by the CFTC, but it still occurs. Even experienced tape readers are mentally exhausted after 30 to 60 minutes in the NQ because the order book dynamics are so intense. Anyone who thinks they can trade raw order flow alone is overestimating themselves.
This is not an argument against order flow. It is an argument against order flow without context. The data is real and valuable, but it needs a filter. Without a filter, it is like trying to listen to a single conversation in a full stadium.
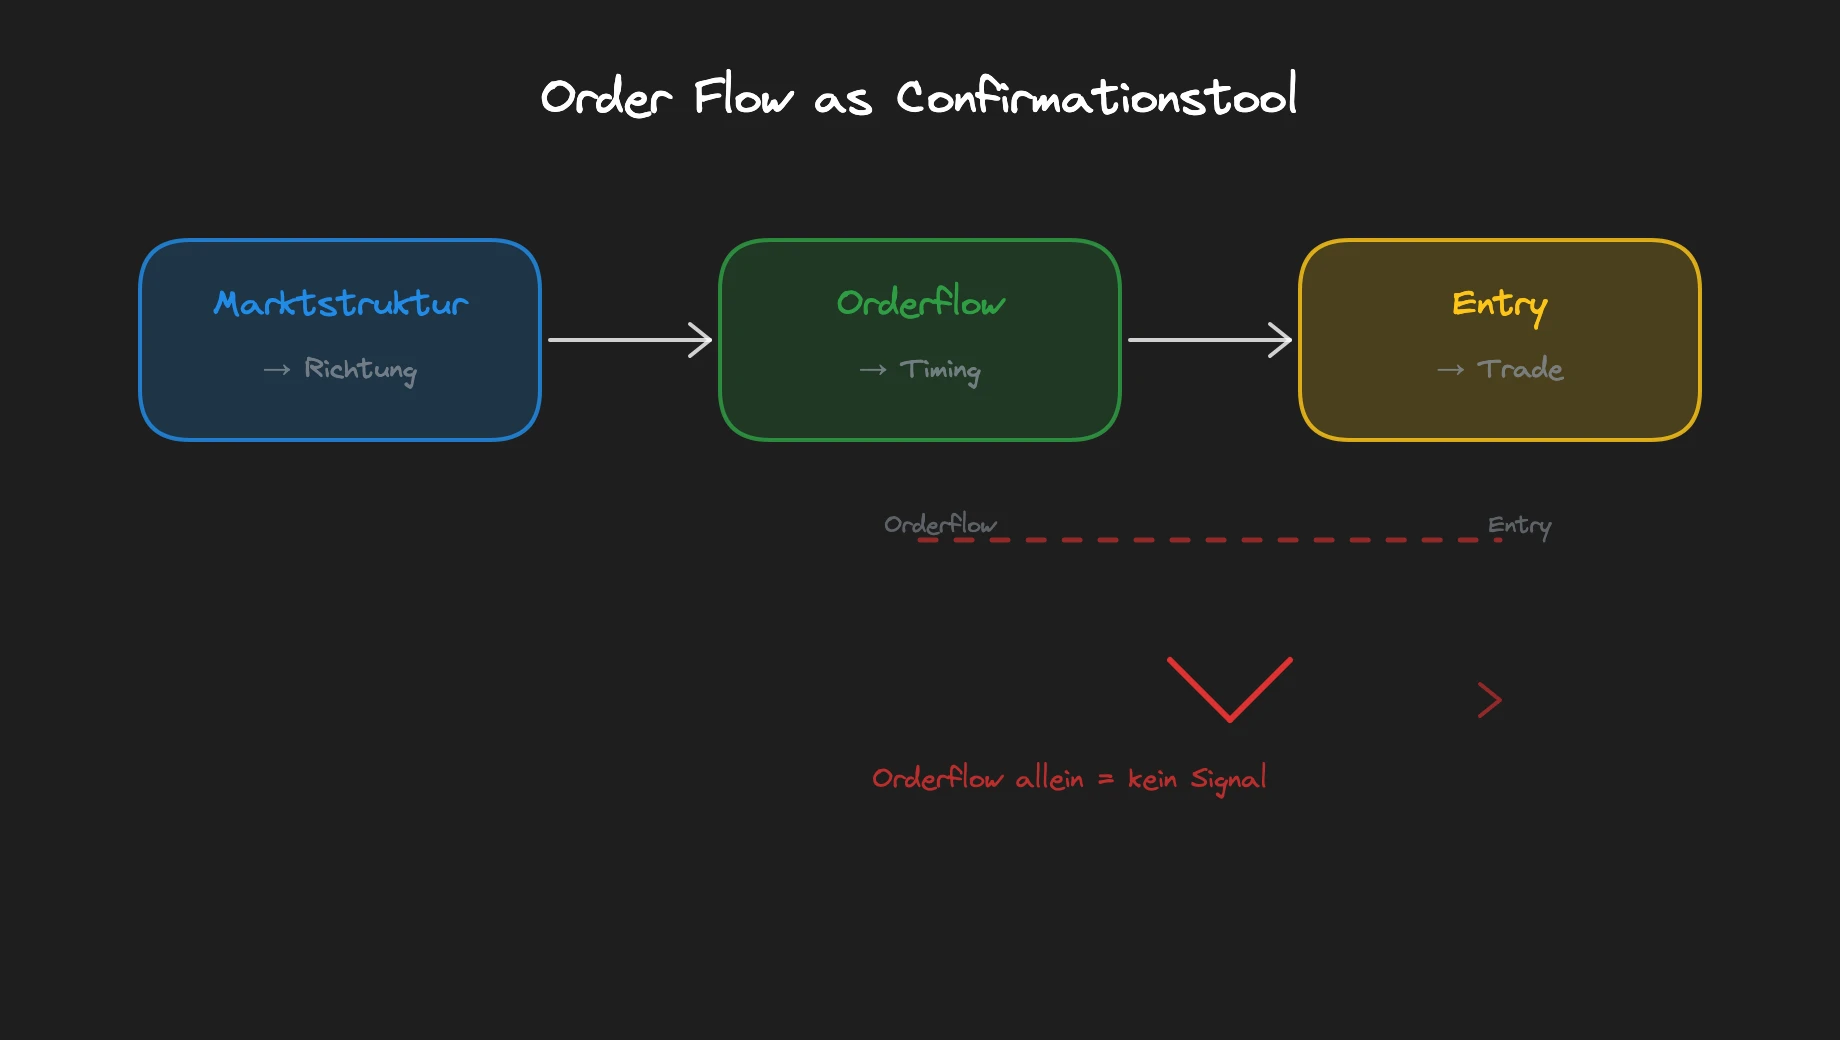
Order Flow as Confirmation Tool, Not Signal Generator
The correct role of order flow: confirmation, not direction provider. The direction of your trade must come from a higher-level analysis: trend, range, options level, structural context. Order flow then confirms the timing of your entry within that direction.
Without a predetermined direction, order flow produces an endless stream of contradictory signals: long, long, short, short, short, long. Impossible to act decisively on that.
"Order flow alone is good data in the wrong context. Within a framework, it becomes a precise timing instrument,"
— Marco Bösing, founder of United Daytraders
The solution: a framework provides the filter that reduces order flow to one direction. Market structure provides the direction. Order flow provides the "when." Together they make a complete setup.
What does that look like in practice? Your framework identifies a functioning uptrend in the NQ. An options level acts as support. Your structural tool shows a confluence. There is room to the next resistance. Now, and only now, you look at order flow: are sellers active at the support level? Yes. Can they push price down? No, the limit buys absorb everything. That's your entry signal. The framework provided the direction. Order flow provided the moment.
Which order flow software is suitable for which purpose is compared in a separate article.
For traders who want to improve their trading psychology, the insight is important: order flow without framework leads to emotional overtrading.
The Three Market Phases in Order Flow
Every market is at any given time in one of three phases. In order flow, each phase has its own signature:
1. Trend: In the order book (e.g., Bookmap), a trend looks exactly like on the candlestick chart, just as a continuous price line with volume overlays. In a trend, you never want to trade against the direction. Wait until order flow also confirms a trend break at the micro level.
2. Range: Range analysis in order flow follows the same logic as on the chart: range high, range low, break, retest. The difference: in order flow, this compresses to seconds instead of hours. A 22-point range in the NQ can dissolve in seconds and release 88 ticks of potential.
3. Momentum (Sweeps): This is the phase where tools like Bookmap are strongest. A sweep shows up as a fast price movement with few or very small volume bubbles. Price moves practically unhindered through empty liquidity zones. Sweeps are typically too fast to trade in real time. But being able to identify them gives you context for the next reaction.
In Bookmap, you recognize a sweep immediately: the absence of volume bubbles during the movement, contrasted with dense bubbles in the preceding or following consolidation. The question about the sweep is always: where did the sweep run to, did it stop at a level, and is a reaction forming there? Order flow answers these questions faster than any other tool.
FAQ: Order Flow Trading
Is order flow trading profitable?
Order flow trading can be profitable, but only within a complete trading framework. Order flow alone is not a trading system. It provides real-time information about supply and demand that, combined with market structure analysis and risk management, can offer a real advantage. Without context and experience, order flow leads to overtrading and losses.
What software do I need for order flow trading?
For Footprint Charts, ATAS, Sierra Chart and Quantower are the most commonly used platforms. For order book visualization, Bookmap is the standard. All require a real-time data feed connection (e.g., through CQG, Rithmic, or data-providing brokers). Costs range from 50 to 200 EUR per month for software and data combined.
Can I use order flow with a small account?
Yes, order flow analysis is independent of account size. You analyze the same data stream as institutional traders. Account size determines your position size and risk management, not the quality of your analysis. However, you need an account that enables futures trading since order flow data is only available for futures and stocks (with Level 2 data).
How long does it take to learn order flow trading?
Expect 3 to 6 months of intensive learning before you can confidently read Footprint Charts and the tape. Operating the software itself can be learned in days. But the ability to recognize in real time whether absorption or exhaustion is occurring, whether a level holds or breaks, requires hundreds of hours of screen time with live markets.
Order Flow Trading: The Next Step
Order flow is not an indicator you turn on. It is a skill you build. In this article, you have learned the basics: the building blocks of order flow, the three levels of representation, the role as confirmation tool, and the honest limits.
In our mentoring program, you'll learn these concepts in over 1,500 video lessons with real chart examples.