COT Report Trading Strategy: Following Institutional Money
The COT Report shows you who is positioned. But positioning alone does not make a trade. I use a 3-stage framework that tells me when positioning becomes relevant, how I combine it with macroeconomic context, and how a directional bias emerges from it. Not a signal, a structured process.
Risk Warning: Trading futures and other financial instruments carries substantial risk of loss. Past performance is not indicative of future results. Only risk capital you can afford to lose.
From Positioning to Bias: The 3-Stage Framework
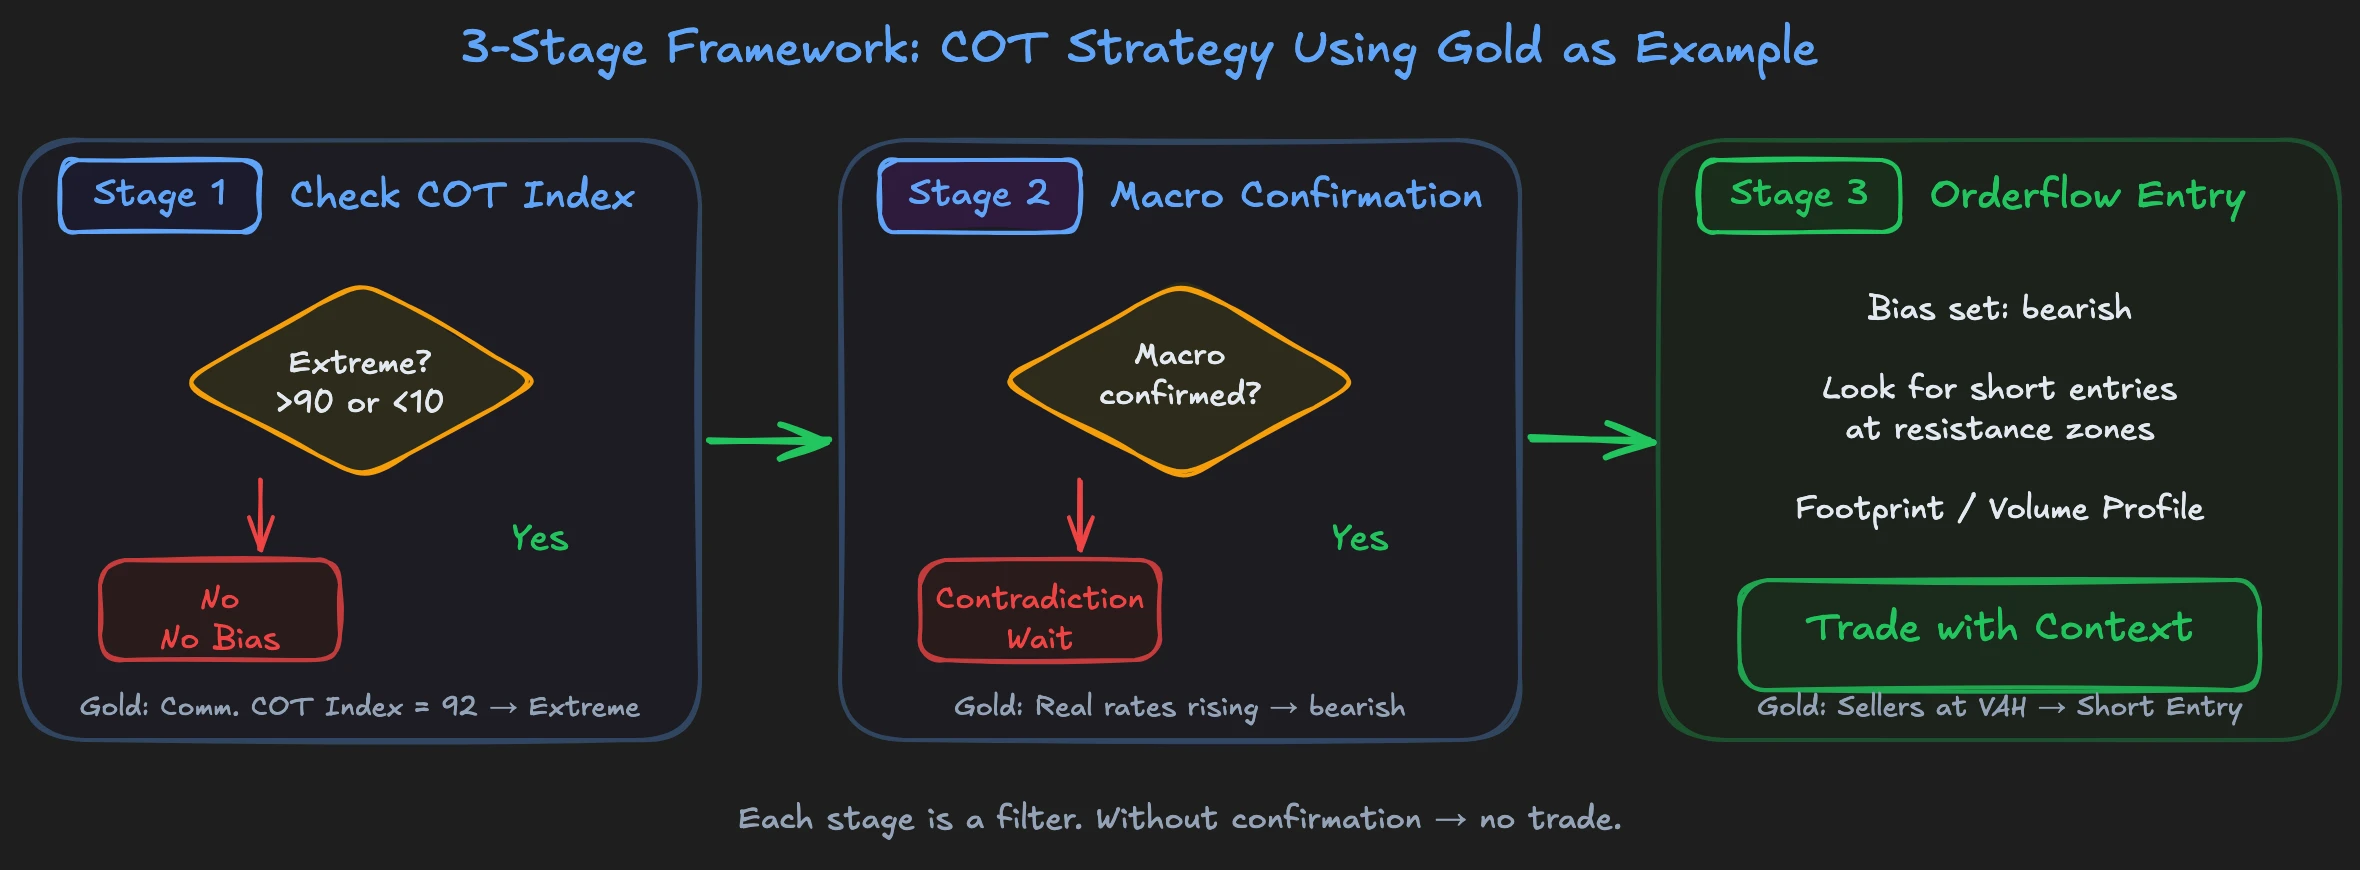
Most traders turn the COT Report into an entry signal. COT Index above 90, short. Below 10, buy. That does not work. What works is a three-stage filter process where each stage must confirm the previous one before you continue.
Stage 1: Check COT Index. You know the formula from the pillar article: the current net position relative to the range of the last N weeks, normalized to a scale of 0 to 100. For practical application, the lookback period is critical. 26 weeks are more responsive and catch sub-year extreme movements faster. 52 weeks are more conservative and filter out seasonal distortions. Both have their justification. Choose one and stay consistent. A COT Index above 90 or below 10 marks an extreme. This is your first filter: is there an extreme? If no, there is no COT-based bias. If yes, continue to Stage 2.
Stage 2: Look for macro confirmation. A COT extreme alone is not enough. It needs fundamental confirmation. Non-Commercials extremely long in gold and simultaneously rising real interest rates? Speculators are overextended, macro pushes against it, bearish bias. Non-Commercials extremely long and falling real interest rates? No contradiction, positioning confirms the trend. No contrarian bias. You wait for resolution.
Stage 3: Entry with Volume Profile and orderflow. COT gives you the direction. Macro confirms it. You find the concrete entry not in the COT Report but at the intraday level. Volume Profile and Orderflow Trading show you where aggressive buyers or sellers appear, where limit orders are absorbing, and where liquidity lies. COT and Volume Profile come from the same institutional money flows. When both point in the same direction, you have the strongest confirmation you can get as a trader. COT tells you where, Volume Profile and orderflow tell you when.
The principle behind the framework is simple: each stage is a filter. You only continue if the previous stage confirms. If a confirmation is missing, there is no trade from the COT setup. This sounds restrictive, and it is. But that is exactly what keeps you out of bad trades.
Which Group Counts in Which Market
Not every group in the COT Report is equally informative in every market. The reason lies in the information structure of the respective markets.
Commodities (Gold, Oil, Wheat): Here, Non-Commercials are the primary reference for direction analysis. Commercials hedge their operational business and therefore almost always run against the trend. Their positions tell you what they are protecting against, not where the market is going. In commodity markets, I exclusively use Non-Commercial net positioning because in simpler markets like coffee or gold, the correlation between speculative positioning and price movement is particularly strong.
Currencies (EUR/USD, GBP/USD): Here too, I follow Non-Commercials, meaning hedge funds and CTAs. In currency markets, there is no physical producer with insider knowledge. Extreme speculative positions show you when a trend is overextended and the probability of a reversal increases. Record net long positions of Non-Commercials in EUR/USD regularly mark trend exhaustion.
Stock Indices (S&P 500, Nasdaq 100): Here, COT analysis is the least reliable. Indices are generally rather long-only markets, which makes interpretation difficult. Market participants' motives are too heterogeneous (portfolio hedging, arbitrage, tactical allocation). If you use COT for indices, then only short-term and in combination with volume profile.
The rule: Follow Non-Commercials. And do not blindly apply the framework to markets where COT data is structurally less informative.
Gold Example: Commercial Extremes and Real Interest Rates
A concrete example shows you how the 3-stage framework works together in practice. Gold is the classic because roles are clearly distributed and macroeconomic context is well measurable via real interest rates.
Stage 1, identify COT extreme. The COT Index of Non-Commercials stands at 92 on a 26-week basis. Hedge funds are as aggressively long positioned as rarely in the last six months. Their net long position is historically high. Stage 1 is fulfilled: there is an extreme.
Stage 2, macro check. Now it gets interesting. You look at real interest rates, measured by the 10-year TIPS yield. Two scenarios:
Scenario A, confirmation: Real interest rates are rising. Rising real interest rates are bearish for gold. Non-Commercials are extremely long, but the macro environment is turning against them. Speculative big money is overextended. Your bias is bearish on a weekly basis.
Scenario B, conflict: Real interest rates are falling. Falling real interest rates are bullish for gold, and Non-Commercials are also positioned bullishly. Both point in the same direction, so no extreme signal. Positioning confirms the macro trend, but no turning point is in sight. No contrarian bias, no trade from the COT setup.
Stage 3, entry. Your bearish bias stands. You look for short entries on rallies. In the Footprint Chart, you watch for aggressive sellers at resistance zones: the Value Area High, the previous day's high, or prominent volume nodes. Your trade has a direction from the COT context, a confirmation from macro, and timing from orderflow.
What you see in this example: the entire process takes days, not minutes. The COT Report delivers the context on Friday. You do the macro analysis on the weekend. The entry comes sometime in the following week when orderflow confirms your direction. Anyone who does not accept this time horizon will not be happy with COT strategies.
The Most Common Mistakes with COT Strategies
Trading extremes directly. A COT Index of 95 does not mean "short immediately." Extremes can become more extreme. An index of 95 can rise to 100 and stay there for weeks. Without macro confirmation and orderflow timing, a COT extreme is just a number.
Forcing timing. The COT Report is a weekly tool. It delivers a bias, not an entry. Anyone who sees COT data on Friday and forces a trade at 9 AM on Monday ignores the core of the framework: patience.
Treating all markets the same. Commodity markets like gold or coffee have clearer positioning patterns than stock indices. Anyone applying the same framework to gold and the S&P 500 is comparing apples to oranges. For indices, you need additional tools like volume profile.
Ignoring Open Interest. A COT extreme with rising Open Interest tells a different story than the same extreme with falling Open Interest. Rising OI with extreme Non-Commercial long position means: new speculative money flows into the market, tension builds. Falling OI with the same position means: positions are being reduced, tension is already resolving.
Ignoring the publication lag in backtests. Charting software displays the COT data point at the Tuesday price, even though you do not see the data until Friday. In backtesting, it looks like you already knew the positioning on Tuesday. In truth, you could not anticipate the price movement from Wednesday to Friday with this data. Anyone ignoring this lag in backtesting gets skewed results.
COT as Part of Your Weekly Plan
COT data is most useful when you systematically embed it in a weekly routine. Ad-hoc analyses lead to cherry-picking, you see what you want to see, not what the data says.
Friday evening: COT data is released at 3:30 PM US Eastern. Scan your 4-6 core markets. Calculate or check the COT Index. Note where extremes exist.
Saturday: Compare COT extremes with current macro context. Which extremes are fundamentally confirmed? Which are in contradiction? Only confirmed extremes flow into your weekly plan.
Sunday: Define your directional bias per market. Write it down. A bias that only exists in your head changes unconsciously as soon as the market opens on Monday.
Monday to Friday: Trade only in the direction of your documented bias. No reversing based on intraday noise. If the COT bias is bearish and the market rises on Tuesday, your bias does not become bullish because of it. You wait for short setups or you do not trade the market.
You can find how to retrieve and process COT raw data step by step in the How to Read COT Report Guide.
FAQ: COT Trading Strategy
Can I trade only with the COT Report?
No. The COT Report delivers direction but not timing. It shows you where institutional money tends, but not when the market turns. Without orderflow analysis or technical tools for entry, you are missing the second half of the puzzle. COT is a compass, not a trading system.
How often do COT-based biases change?
It depends on the market and Non-Commercial activity. Often the direction remains stable over several weeks because institutional campaigns are measured in weeks, not days. But a significant shift in a single week can turn the bias immediately. After the Corona crash, Non-Commercials aggressively shifted their positioning one to two weeks before the massive rally. Therefore: compare fresh every week, do not rely on inertia.
Which tools visualize the COT Index?
TradingView offers an integrated COT indicator that you can place directly over your charts. This is the simplest solution: you see net positions as a histogram directly below the price chart. Additionally, the CFTC provides all raw data and historical downloads free of charge on its website.
In our mentoring program, you'll learn these concepts in over 1,500 video lessons with real chart examples. The macroeconomics course with 20 video lessons teaches you how bonds, interest rates, and economic data connect. The COT strategy is a central building block: you build step by step the weekly workflow that ranges from institutional positioning to concrete intraday entry.