COT Report Explained: What Commitment of Traders Data Tells You
The COT Report shows you every week how hedge funds and commodity producers are positioned in US futures markets. The CFTC publishes this data free of charge. I have used the report for years as a compass for weekly direction, not as a signal.
Risk Warning: Trading futures and other financial instruments carries substantial risk of loss. Past performance is not indicative of future results. Only risk capital you can afford to lose.
What the COT Report Is and Why It Exists
COT stands for "Commitment of Traders." The report is published by the US Commodity Futures Trading Commission (CFTC). Every Friday at 3:30 PM US Eastern Time, the data is released, showing the positioning snapshot from the previous Tuesday. There is a three-day gap between data collection and publication. You need to know this time lag because it determines how you interpret the data.
The history of the COT Report dates back to 1962, when the then Commodity Exchange Authority published the first report for 13 agricultural markets. Since 1974, the CFTC has handled this task. Today, the report covers futures and options markets ranging from commodities to currencies, interest rate products, and stock indices.
What makes it special: The COT Report is the only publicly available source that shows you how institutional market participants are actually positioned. Not what they say, not what analysts speculate, but what they actually do. The data is freely available on the CFTC website.
For traders who trade futures, the COT Report is a tool that costs nothing but reveals more about market participants than any paid indicator. But only if you read it for what it is: a compass, not a GPS.
There are different versions of the report. The "Legacy Report" is the original version with the three classic groups (Commercials, Non-Commercials, Non-Reportables). Since September 2009, the CFTC also publishes the "Disaggregated Report" for commodities and the "Traders in Financial Futures" (TFF) report for financial contracts. These newer versions break down market participants more finely but are more complex. For getting started and for weekly macro analysis, the Legacy Report is the best starting point.
The Three Groups in the COT Report
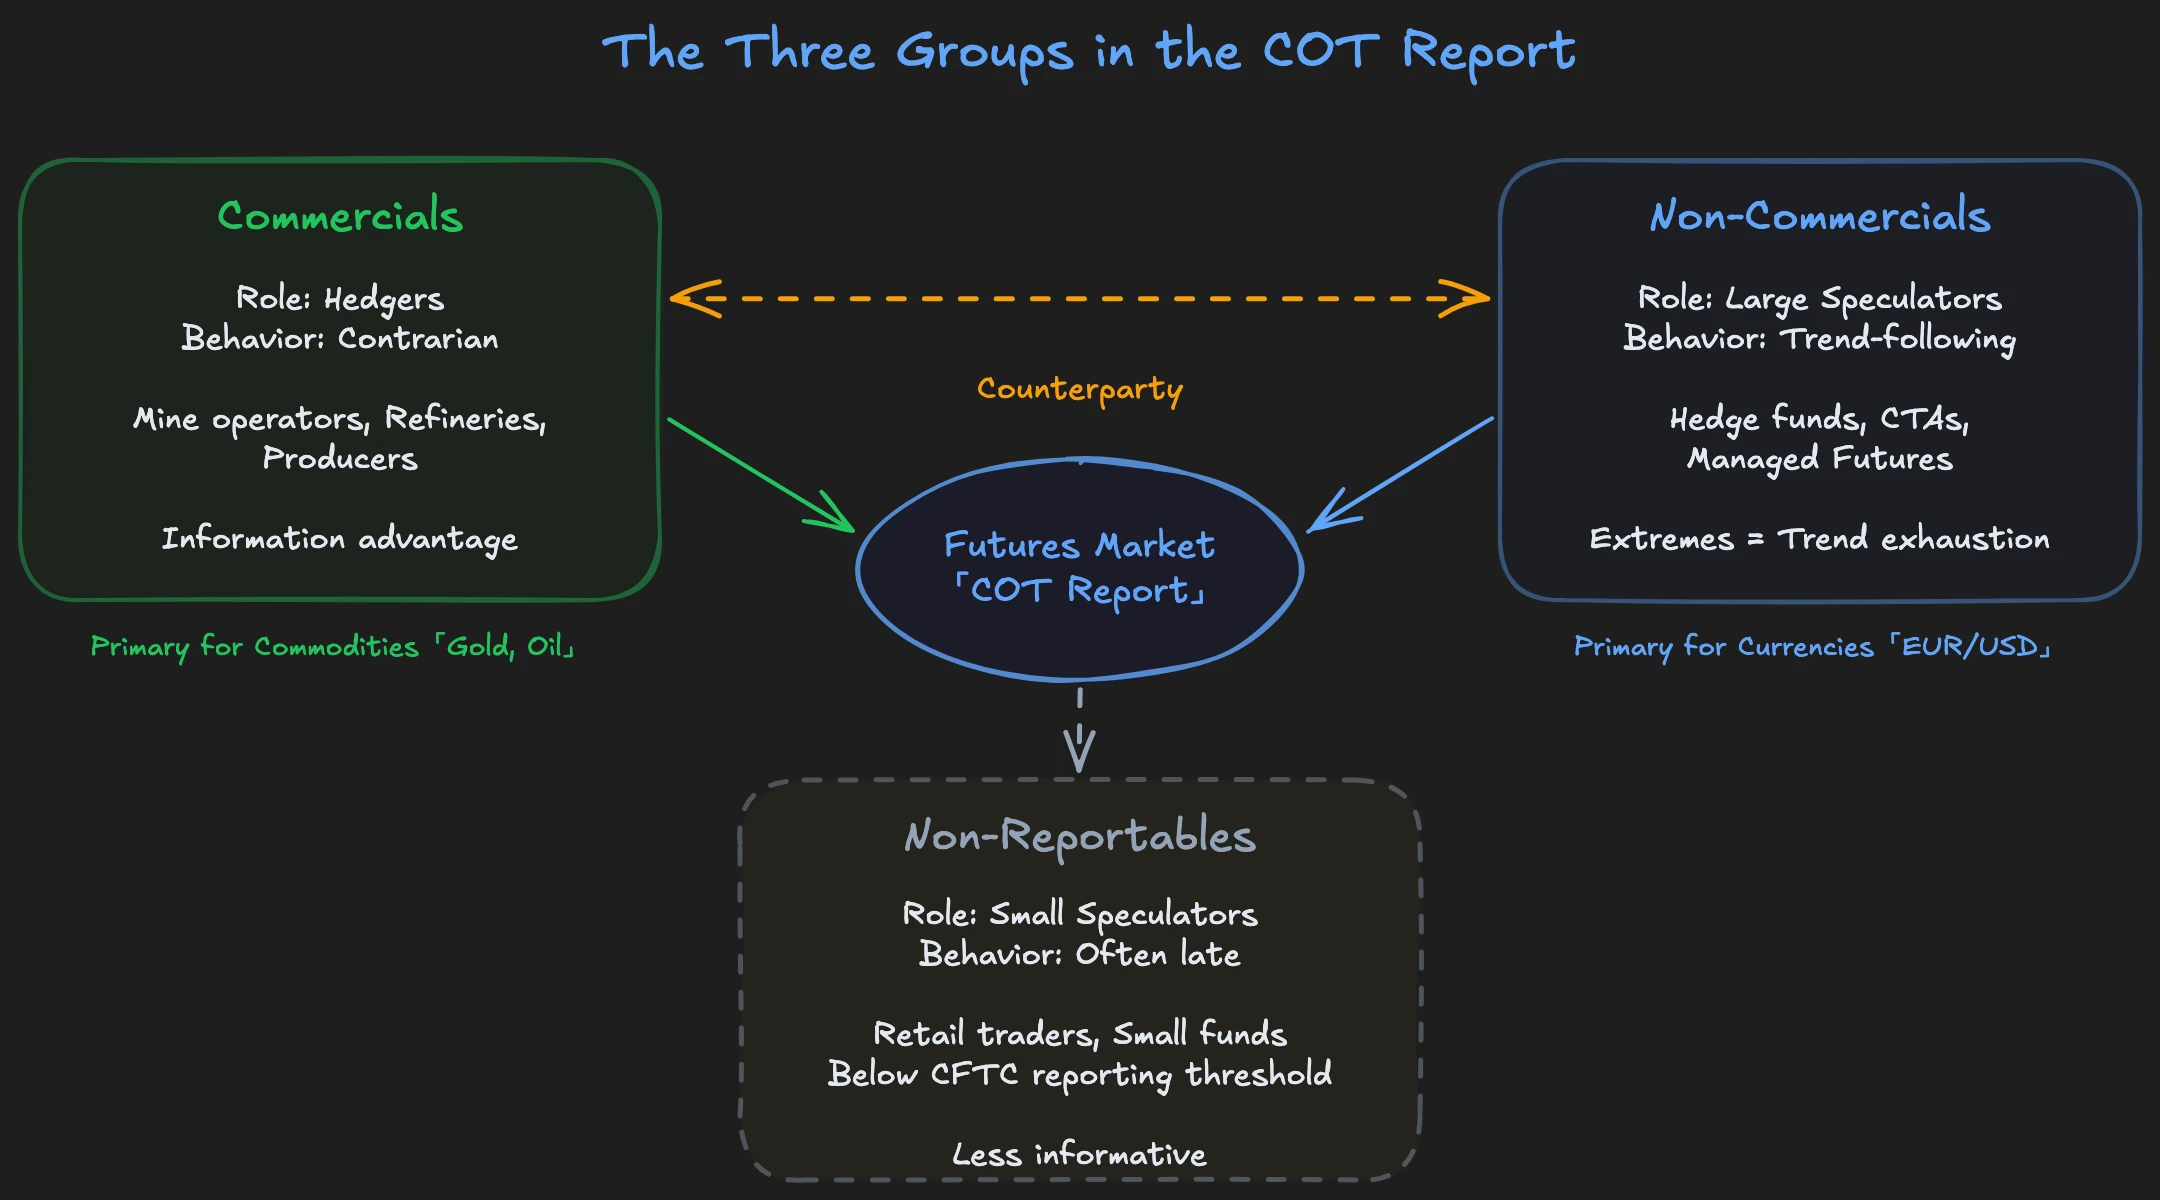
The COT Report divides all reportable positions into three categories. Each group has different motives, different time horizons, and different behaviors. If you want to understand the report, you first need to understand who these groups are and why they trade.
Commercials: The Hedgers
Commercials are companies that use futures to hedge their operational business risk. A gold mine operator selling future production today at a fixed price. An airline buying jet fuel futures to protect against rising oil prices. An agricultural corporation hedging its harvest.
This group does not trade to speculate. They trade to protect their real business. Commercials are naturally positioned contrarian: they sell into rising markets and buy into falling ones. When a commodity producer sees the price of their product rising, they hedge more. They sell futures to lock in the good price. In the COT Report, this looks like short building, even though it is actually a sign of economic strength.
This hedging motive makes Commercials difficult to interpret for trading bias. Their positioning does not reflect where they expect the market to go, but what they are protecting against. Because they own the real product and hedge, their net position almost always runs against the trend. For determining weekly direction, Commercials are not the group you should follow. In my analysis, I consciously ignore Commercials and focus exclusively on Non-Commercials.
Non-Commercials: Large Speculators
Non-Commercials are large speculative market participants: hedge funds, Commodity Trading Advisors (CTAs), managed futures funds, and other institutional speculators. This group trades exclusively to generate profits. They have no physical product to hedge. And that is exactly what makes them the most important group in the COT Report for your trading.
Non-Commercials are the group you follow. Their net positioning shows you where speculative big money is looking. These institutions spend millions on analysts, research, and models to find the right direction. When they go long, they have reasons. When they go short, likewise. Their positioning is not an opinion but a commitment with real money.
The behavioral pattern: When Non-Commercials build their net long position, the price often follows in the same direction weeks later. The correlation between positioning change and price movement is consistent across many markets. In my time as an institutional trader, I experienced exactly this: analysts deliver the direction, traders execute. Sometimes Non-Commercials position themselves one, two, three weeks before the actual price movement. They show you the direction before the chart confirms it.
For practical use, a simple comparison is enough: Is the net position of Non-Commercials this week higher or lower than last week? If it's rising, your weekly bias is long. If it's falling, your bias is short. This alone gives you a weekly direction based on the decisions of the best-informed speculators.
Non-Reportables: Small Speculators
Non-Reportables are all market participants whose positions fall below the CFTC reporting threshold. Historically, this group was called "dumb money" because it was reliably wrongly positioned at extreme points. Retail traders entering trends too late and exiting too late.
This view has changed in recent years. Market structure has shifted. Algorithmic trading, passive index funds, and market fragmentation have made Non-Reportables less informative than before. The group has become smaller, and its positioning fluctuates less dramatically.
Still, it can be useful in certain markets. In smaller commodity markets where retail participation is proportionally higher, extreme Non-Reportable positions occasionally indicate turning tendencies. But as a standalone indicator, they are not reliable enough. Use them as supplementary information, not as a primary signal.
Open Interest: The Forgotten Dimension
Most traders reading the COT Report focus on the net positions of the three groups. That is important, but only half the story. Open Interest, the total number of all open contracts in a market, gives you a second dimension that many overlook.
Open Interest rises when new positions are opened. Both sides of a new trade, buyer and seller, enter the market. Open Interest falls when existing positions are closed. Both sides leave the market. This sounds simple, but the implications are enormous.
Imagine the gold price rising from $2,000 to $2,100. If Open Interest rises at the same time, new capital flows into the market. Buyers open new long positions, and sellers take the other side. This is genuine conviction buying. If Open Interest falls during the price increase, existing short positions are being closed. The price increase is then just short covering, no new commitment. The difference is critical for the sustainability of the move.
The combination of price change and Open Interest change creates four scenarios you need to know:
| Scenario | Meaning | Trend Strength |
|---|---|---|
| Price rises + OI rises | New money flows into the market on the long side. Fresh demand supports the uptrend. | Strongly bullish |
| Price rises + OI falls | Short covering drives the increase, no new buyers. | Trend vulnerable |
| Price falls + OI rises | New money enters the market on the short side. Fresh sellers support the downtrend. | Strongly bearish |
| Price falls + OI falls | Long liquidation, existing positions are being closed. | Trend losing substance |
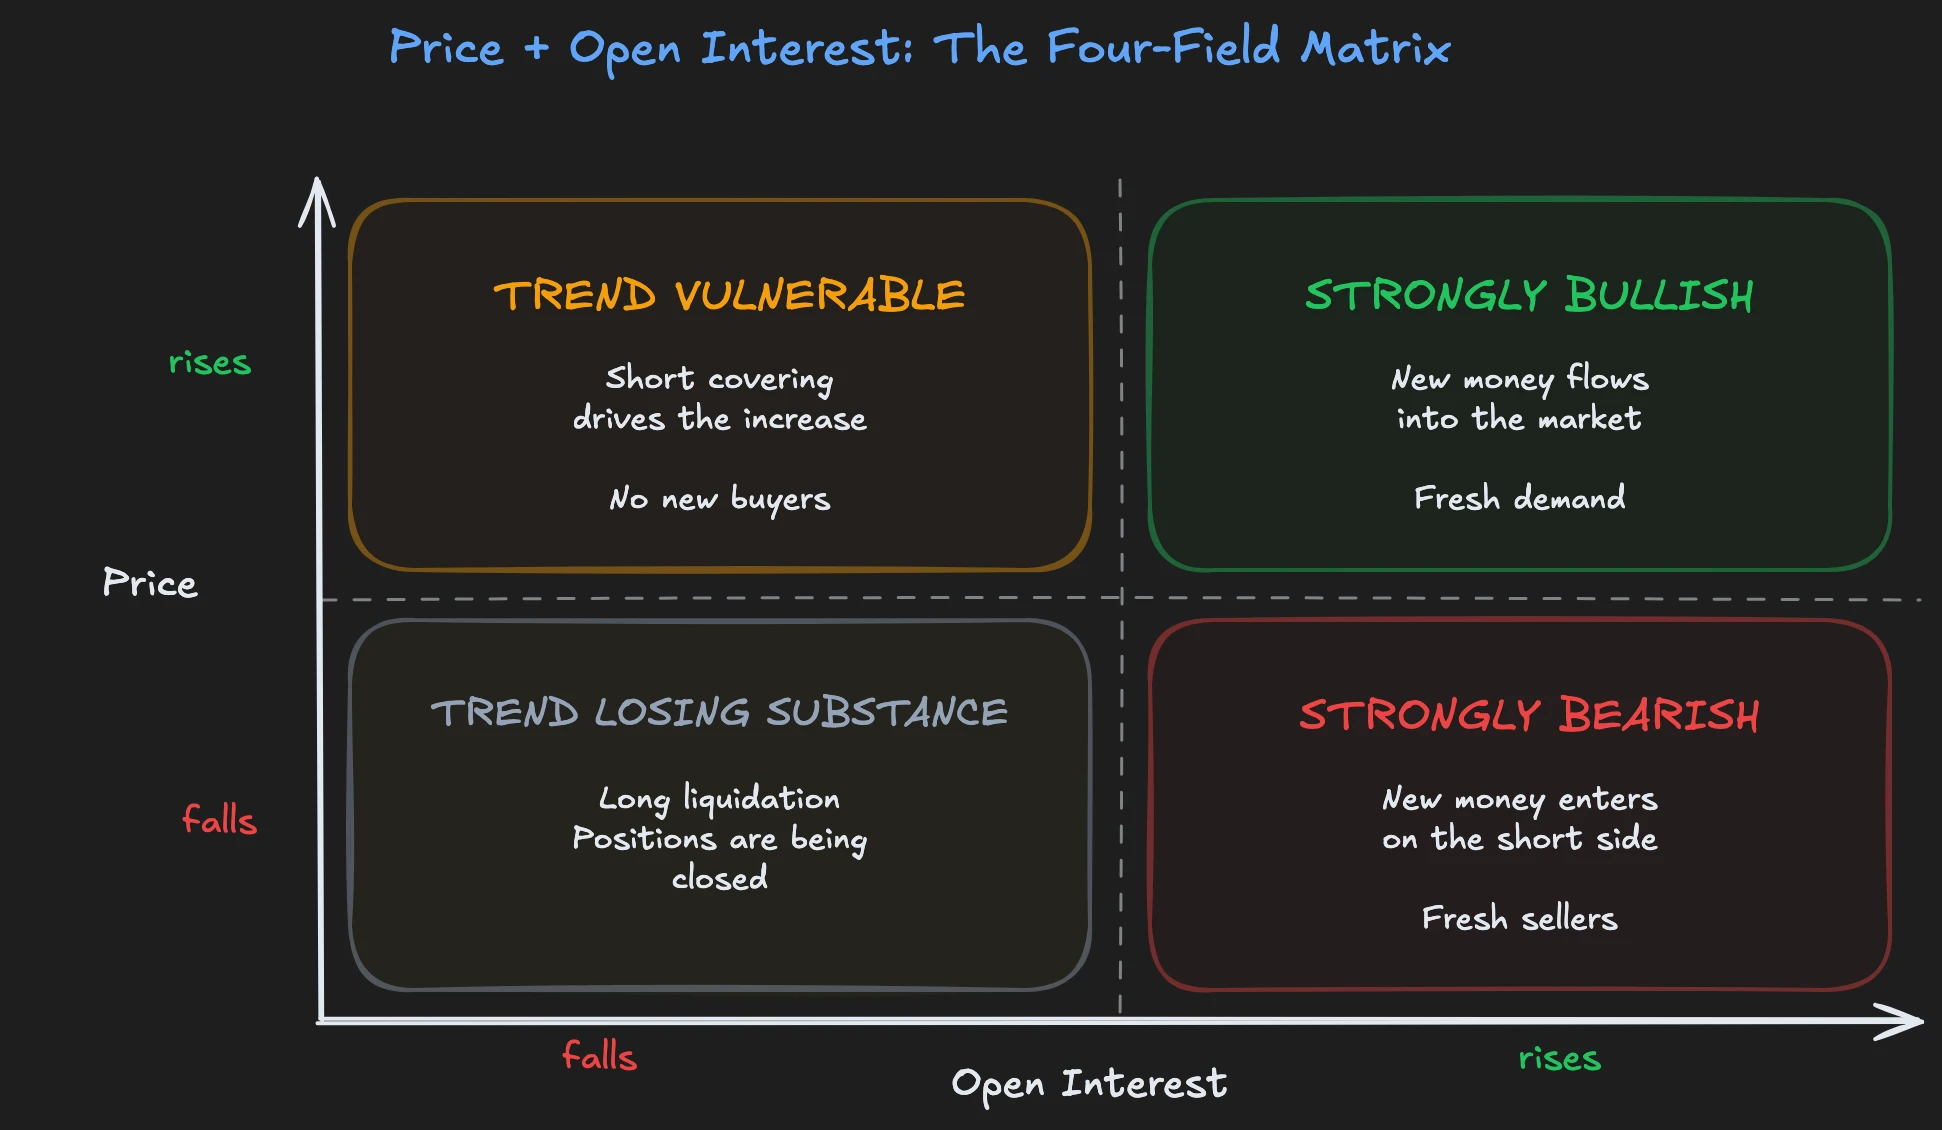
This matrix is not a timing tool. It does not tell you when to buy or sell. But it tells you whether the current price movement stands on solid ground or on shaky legs. And that is exactly the kind of information a compass provides.
How to Read the COT Report Correctly
Raw COT data is just numbers at first. Thousands of contracts, divided by groups. To make usable information from this, you need two concepts: net positions and the COT Index.
Calculating Net Positions
You calculate a group's net position by subtracting the number of short contracts from the number of long contracts. If Commercials hold 150,000 long contracts and 200,000 short contracts in gold, their net position is -50,000 contracts. They are net short.
The absolute number alone says little. What matters is the change from week to week. If the net short position of Commercials in gold jumps from -50,000 to -80,000 within three weeks, producers are hedging aggressively. They apparently do not expect the gold price to rise much further and are using the current level to lock in.
Track net positions over multiple weeks. Single data points are noise. Trends in positioning are information. If Non-Commercials have been building their net long position in a market continuously for eight weeks, that shows clear speculative commitment. If they suddenly start reducing it, the story changes.
The COT Index
Raw net positions have a problem: they are not comparable across different markets or time periods. A net long position of 100,000 contracts in Crude Oil means something completely different than 100,000 contracts in wheat. That is why you normalize the data with the COT Index.
The COT Index relates the current net position to the range of the last 26 or 52 weeks:
COT Index = (Current Net Position - Minimum of last N weeks) / (Maximum of last N weeks - Minimum of last N weeks) x 100
The result is a value between 0 and 100. A COT Index of 90 or higher means current positioning is extremely high in historical comparison. A value of 10 or lower shows a historical extreme on the other side.
COT Index extremes are not trading signals. They are warning signs. If the COT Index of Commercials in gold is at 95, it tells you: producers are hedging as aggressively as rarely before. This does not mean gold will fall tomorrow. But it means the most informed group in the market considers the current price high enough to hedge massively. This is a compass showing you a direction, not a GPS with an exact destination address.
COT in Practice: Three Examples
Theory is important, but you need to see how the COT Report works in real markets. Three examples show you the different dynamics.
Gold
The gold market is the classic for COT analysis. On the Commercial side are mine operators and refineries hedging their production. When the gold price rises, they sell futures to fix their future production at a good price. Their net short position grows with rising prices.
The key with gold: combine COT data with real interest rates. Gold competes with interest-bearing investments. When real interest rates (nominal rate minus inflation) fall, gold becomes more attractive. If Commercials are extremely short at the same time, you have a situation where producers consider the current price historically high while the macroeconomic environment actually supports gold. This divergence between macroeconomic tailwind and historical Commercial positioning creates tension. And tension in the market eventually resolves.
Crude Oil
Crude oil is more complex because both producers and consumers are on the Commercial side. Oil producers hedge by selling futures. Airlines and refineries hedge by buying futures. The net position of Commercials in Crude Oil is therefore harder to interpret than in gold.
Seasonal patterns also play a role. In spring, when driving season in the US approaches, demand for gasoline typically rises, and refineries buy Crude Oil futures. In fall, this reverses. This seasonality overlays speculative flows and makes pure COT analysis without seasonal context less informative.
What works particularly well with Crude Oil: Non-Commercial positioning at extremes. When hedge funds have built a record-high net long position in Crude Oil and OPEC simultaneously raises production limits, you have an imbalance. Too many speculative longs meet fundamental oversupply. The market becomes vulnerable.
EUR/USD (6E Futures)
In the currency market, the COT data of Euro FX futures (6E) is particularly revealing. Non-Commercials, meaning hedge funds and CTAs, build large directional positions in Euro trends. Because the forex market is strongly driven by macroeconomic cycles, speculative positions tend to run in one direction for a long time and then reverse abruptly.
Historically, extreme Non-Commercial positions in EUR/USD show a high hit rate in identifying trend exhaustion. When the net long position of Non-Commercials reaches a multi-year high, the Euro uptrend is often in its late phase. Not tomorrow, not next week, but within the coming weeks to months, a correction becomes more likely.
That is the core of COT analysis: it does not give you an entry point. It gives you a direction and a time horizon. You have to find the entry with other tools.
What all three examples have in common: the COT Report alone never delivered a concrete buy or sell signal. It showed you which way the scales tip. The actual decision always came from combining it with other data. That is exactly how you should use the report: as a compass showing you the cardinal direction, not as a navigation system dictating every step.
What the COT Report Cannot Do
Every good tool has limits. And you need to know the limits of the COT Report before integrating it into your analysis.
The most obvious disadvantage is the three-day time lag. You see Tuesday's positions on Friday. In fast markets, positioning may have already changed by then. The COT Report is therefore a weekly tool, not an intraday tool.
For stock indices like the S&P 500 or Nasdaq 100, COT analysis is less reliable than for commodities or currencies. The reason: stock index futures are used for a variety of purposes, portfolio hedging, tactical asset allocation, arbitrage. The motives of Commercials in stock index futures are so diverse that their net position is less clearly interpretable.
An often overlooked trap: charting software displays the COT data point at the position in the chart where the price stood on Tuesday when the data was collected. But you do not see this data until Friday. In backtesting, it looks like you knew the positioning exactly at the Tuesday price and could trade after it. In reality, you could not anticipate the price movement from Wednesday to Friday with this data. Anyone backtesting COT strategies must consistently account for this lag, otherwise the results are skewed.
Market structure is changing. Passive investing, ETFs, and algorithmic trading have changed the composition of market participants over the last two decades. COT patterns that worked reliably 15 years ago may not have the same informative value today. You need to calibrate your analysis regularly.
And the most important point: the COT Report is not a standalone trading system. It is a context provider. It answers the question "Who is positioned how?" It does not answer the question "What should I do now?"
A common mistake: traders see an extreme Commercial position and immediately trade against it. But "extreme" can become more extreme. A COT Index of 95 can rise to 100. The market can remain in an extreme for weeks or months before the positioning resolves. Anyone misusing the COT Report as a timing tool will regularly enter too early and go through drawdowns that could have been avoided.
"We never used COT as a signal. It was context. A puzzle piece that showed us where smart money stood. The actual decision always came from the big picture."
— Marco Bösing, founder of United Daytraders
COT Report and Your Trading: The Right Workflow
How do you practically integrate the COT Report into your weekly routine? The workflow follows the macro to micro principle: first the big picture, then the details.
Step 1: Weekly check. Every Friday evening or Saturday morning, look at the current COT data. How has the net position of Non-Commercials changed? Has it risen or fallen compared to the previous week? Has Open Interest changed significantly?
Step 2: Derive bias. The comparison with the previous week gives you the weekly direction. If the Non-Commercial net position has risen, your bias is long. If it has fallen, your bias is short. At extreme COT Index values (above 90 or below 10), the probability of a trend reversal increases, but the extreme alone is not a signal.
Step 3: Macro confirmation. Your COT bias becomes stronger when the macroeconomic picture confirms it. Non-Commercials extremely long in gold and simultaneously rising real interest rates? Speculators are overextended, macro pushes against it. Non-Commercials extremely long and falling real interest rates? No contradiction, positioning confirms the trend.
Step 4: Entry via orderflow and volume profile. COT tells you the direction. You find the concrete entry with Volume Profile, Footprint Charts, and Orderflow Trading. COT and Volume Profile come from the same institutional money flows. When both point in the same direction, you have strong confirmation.
This macro-to-micro workflow is not a rigid system. It is a framework that you adapt to your style. Some traders also look at seasonal patterns. Others combine COT with options data. The core remains the same: COT provides the context, not the signal.
A practical example: You see in the COT Report that Non-Commercials in Crude Oil have built their net long position by 25,000 contracts within a week. At the same time, Open Interest rises. New speculative money flows into the market on the long side. Your bias for the following week is bullish. On Monday, you open your charts and watch Volume Profile and orderflow for whether aggressive buyers appear at support levels. The COT Report prepared the direction, Volume Profile and orderflow deliver the entry.
How to translate the COT Report step by step into concrete COT trading strategies is covered in a separate article.
FAQ: COT Report
Where can I find the COT Report?
You can find the official data on the CFTC website. The raw data is free and updated every Friday. There are also third-party websites and tools that process, visualize, and automatically calculate the COT Index. You can find a detailed guide for access and processing in our How to Read COT Report Guide.
Is the COT Report a buy signal?
No. The COT Report shows positioning, not timing. It tells you who is positioned how, but not when the market turns. Extremes in the COT Index increase the probability of a trend reversal, but the market can remain in an extreme range for weeks or months. Use COT as a compass for your bias formation, not as a trigger for trades.
Does the COT Report work for stock indices?
Only to a limited extent. For stock indices like the S&P 500 or Nasdaq 100, interpretation is more difficult because Commercial positions reflect very heterogeneous motives: portfolio hedging, tactical allocation, arbitrage. For commodities and currencies, where the roles of market participants are more clearly defined, the COT Report delivers significantly more reliable information.
How often should I check the COT Report?
Once a week is enough. The report is released on Fridays, and the data does not change during the week. More than a weekly check leads to overanalysis without additional information gain. Best to integrate COT analysis into your weekend routine, along with macroeconomic analysis and planning for the coming trading week.
Can I combine COT with orderflow trading?
Yes, and that is exactly the recommended approach. COT provides the weekly macro context: who is positioned how, where are the extremes? Orderflow trading delivers the intraday entry: where are limit orders absorbing aggressive sellers, where is a trend exhausting? COT is the compass, orderflow is the magnifying glass. Together they give you a complete picture from macro to micro.
COT Report Explained: The Next Step
The COT Report is not secret knowledge or a holy grail. It is a freely accessible tool that shows you every week where institutional money stands. Nothing more, nothing less. Its value lies not in giving you signals. Its value lies in giving you context that most retail traders do not have.
In our mentoring program, you'll learn these concepts in over 1,500 video lessons with real chart examples. The macroeconomics course with 20 video lessons teaches you how bonds, interest rates, and economic data connect. COT analysis is a central building block: you learn how to combine COT data with macroeconomic indicators, seasonal patterns, and orderflow analysis, not as an isolated tool but as part of a complete workflow from macro to micro.