How to Read the COT Report: A Step-by-Step Guide
You read the COT Report directly on the CFTC website at cftc.gov. You essentially need three things: the Non-Commercial net position, Open Interest, and the weekly change. In this guide, I show you step by step how to get from the raw data source to weekly analysis and which strategy follows from it.
Risk Warning: Trading futures and other financial instruments carries substantial risk of loss. Past performance is not indicative of future results. Only risk capital you can afford to lose.
Navigating the CFTC Website
The direct path: cftc.gov → Market Data & Economic Analysis → Commitments of Traders. There you will find three different report types you need to know.
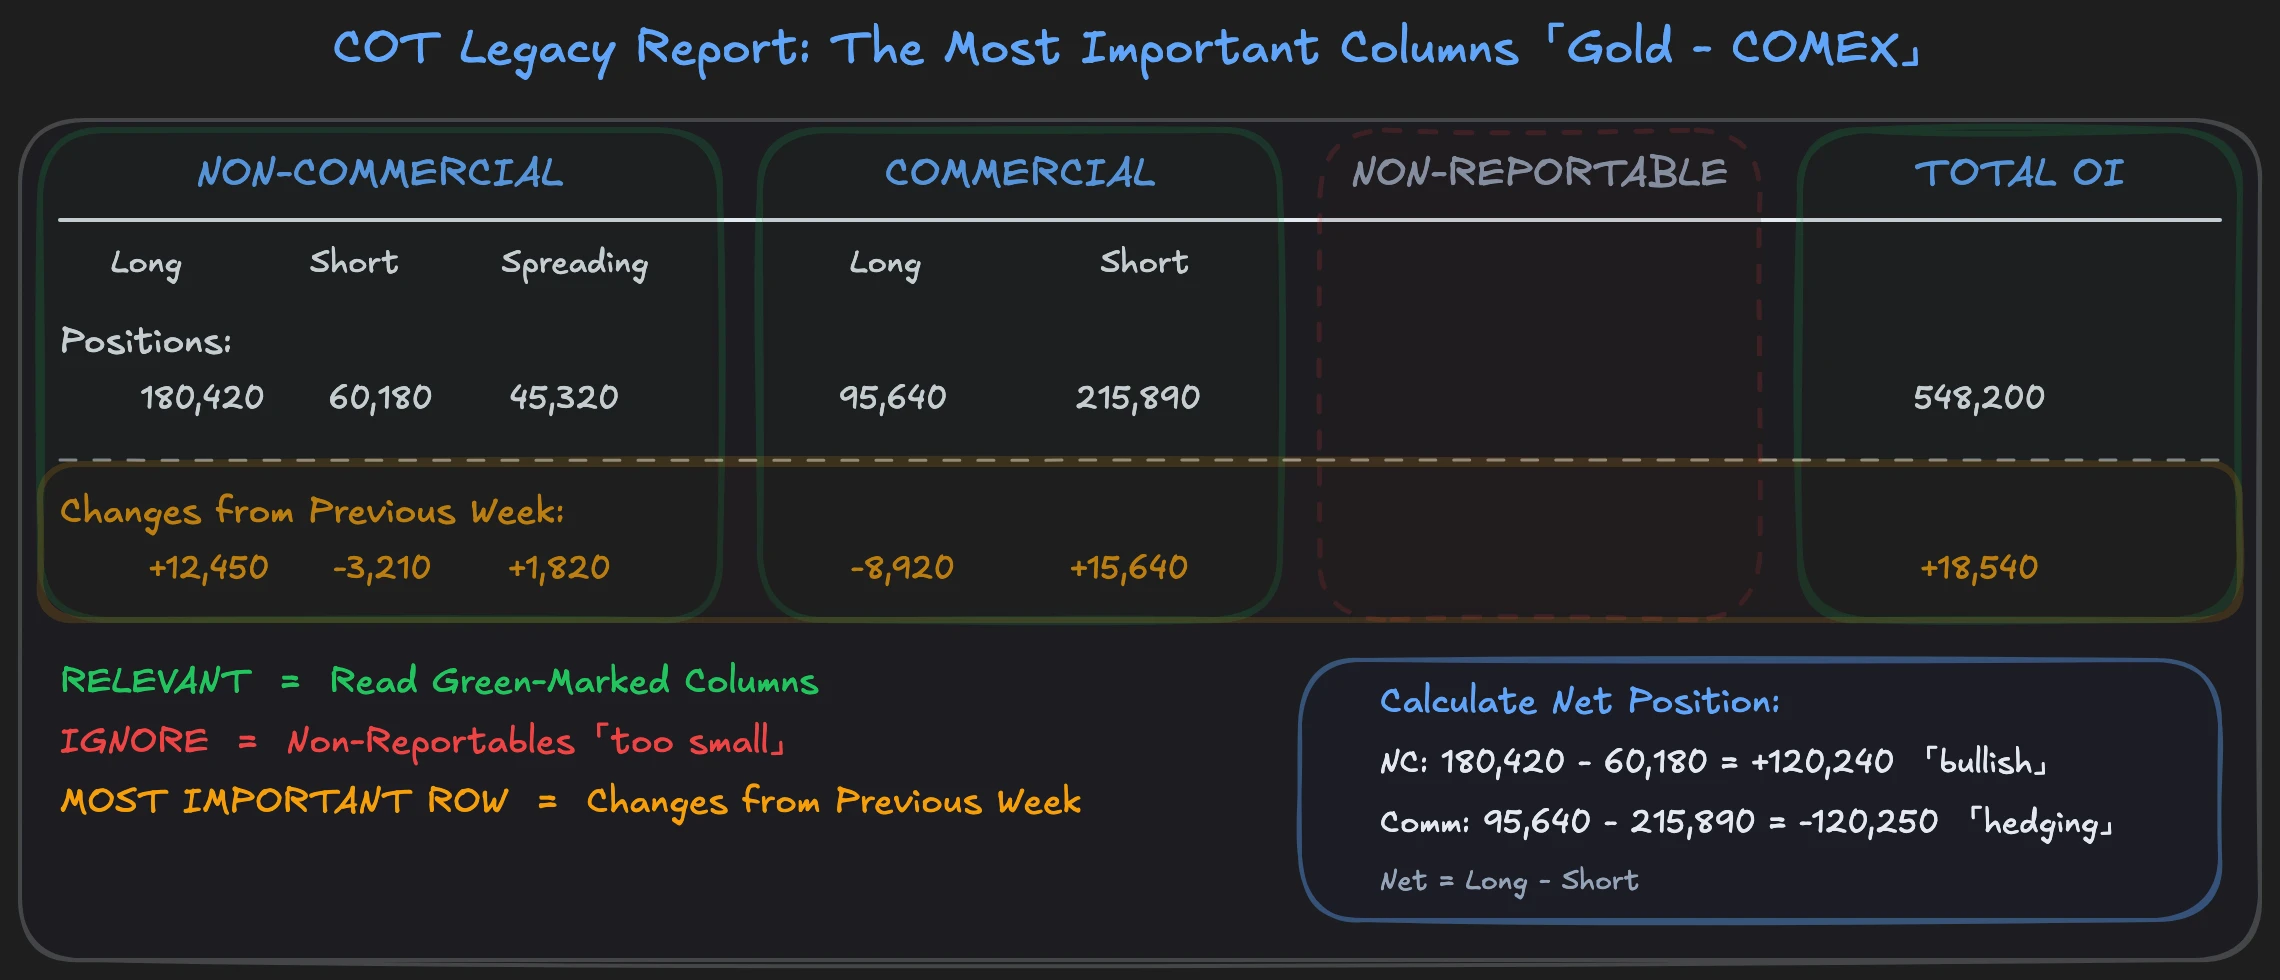
The Legacy Report is the classic division into three groups: Commercials, Non-Commercials, and Non-Reportables. It has existed for decades and is the best entry point. The three groups correspond exactly to the categories you know from the COT basics.
The Disaggregated Report breaks down more finely: Producer/Merchant, Swap Dealers, Managed Money, and Other Reportables. More granularity for commodity markets, but also more complexity. Not necessary for the weekly workflow.
The Traders in Financial Futures (TFF) report covers financial contracts (currencies, stock indices, interest rate products). If you analyze EUR/USD or S&P 500 futures, you find the data here.
The recommendation: Start with the Legacy Report. It is the easiest to read and covers everything you need for weekly macro analysis.
On the CFTC website, you also choose between "Futures Only" and "Futures + Options Combined." Take "Futures Only," the data is cleaner and easier to interpret. Then there is the choice between Short Format and Long Format. The Short Format contains all relevant columns. The Long Format adds concentration ratios that you do not need for weekly analysis.
Reading the Report: The Most Important Columns
The COT Report looks at first glance like an endless table with thousands of numbers. It is. But you only need a fraction of it. Let us look at this using gold as an example, listed in the report as "GOLD - COMMODITY EXCHANGE INC." under COMEX.
The columns you must read:
- Non-Commercial Long / Short / Spreading, the positions of large speculators. Long minus Short gives the net position that shows you which way hedge funds are betting.
- Commercial Long / Short, the positions of hedgers. Mine operators, refineries, the physical market participants.
- Total Open Interest, the total number of all open contracts. Shows you whether new money is flowing into or out of the market.
- Changes from Previous Week, the change from the previous week. The most important row in the entire report.
Here is how you proceed step by step:
- Find gold in the report (CTRL+F for "GOLD").
- Note the Non-Commercial net position: Long minus Short.
- Note the Commercial net position: Long minus Short.
- Note the Total Open Interest.
- Read the "Changes from" row, the weekly change for each group.
What you can initially ignore: Non-Reportables (too small for reliable statements), Spreading (offsetting positions in different contract months, not relevant for weekly bias) and Percent of Open Interest (redundant when you have the absolute numbers).
The most important insight: The "Changes from" row is more meaningful than the absolute numbers. A shift of 20,000 contracts in one week tells you more than a static position of 200,000. The trend in the change shows you where positioning is moving, not where it stands, but where it is going.
Calculating Net Positions and COT Index
You calculate the net position simply: Long minus Short for the respective group. If Non-Commercials hold 180,000 long and 60,000 short contracts, their net position is +120,000. They are clearly positioned bullishly.
To put this number in historical context, you need the COT Index. You know the formula from the pillar article:
COT Index = (Current Net Position − Minimum) / (Maximum − Minimum) × 100
The problem: the CFTC report shows you only the current week plus the change from the previous week. For the COT Index, you need historical data, at least 26 weeks, better 52.
Where do you get this historical data? The CFTC offers bulk downloads (text and Excel files) with data spanning decades. You find them under "Historical Compressed" on the COT page. You can import these files into Excel and calculate the COT Index yourself with a rolling 26-week min/max formula. Enter week by week, reference the minimum and maximum of the last 26 rows, apply the formula. It works, but it is manual.
Or you save yourself the work and use tools that calculate the COT Index automatically.
Free Tools for COT Analysis
You do not have to manually assemble the COT Report from CSV files. Several free tools do the processing for you.
TradingView (COT Indicator) is the best option for COT analysis. Search for "COT" in the indicators, and you get a histogram overlay that displays net positions directly below your chart. This way you see positioning extremes visually in the context of price movement. Additionally, the CFTC itself provides all raw data and historical downloads free of charge if you want to go deeper.
I used to pay over $1,000 for COT software just to have the data in the chart. Today this is free with TradingView.
The Most Common Mistakes When Reading the COT Report
Reading absolute numbers instead of changes. A net short position of -150,000 contracts sounds extreme. But is it? If it has stood at this level for six months, it is the new normal. If it jumped from -80,000 to there within three weeks, that is an aggressive shift. Context decides, not the number.
Ignoring Open Interest. Net position changes without Open Interest context tell only half the story. A shift of 20,000 contracts with rising Open Interest means: new money flows into the market, new conviction emerges. The same shift with falling Open Interest means: existing positions are being closed, no new commitment.
Using COT for unsuitable markets. Not every market is suitable for COT analysis. For stock indices, Commercial motives are too heterogeneous for clear interpretation. The COT Report delivers the best results for commodities and currencies, where the roles of market participants are clearly defined. Which group is most informative in which market is covered in detail in the strategy article.
Ignoring changes. The weekly change of the Non-Commercial net position is your most important signal. Compare the current data point with the previous one: has positioning risen or fallen? This already gives you the weekly bias. A significant shift in a single week is not noise but real commitment with real money. Large speculators do not move 30,000 contracts by chance.
FAQ: Reading the COT Report
When are COT data published?
Every Friday at 3:30 PM US Eastern Time. The data reflects the positioning snapshot from the previous Tuesday. There is a three-day gap between collection and publication. You must account for this time lag in your interpretation. In fast-moving markets, positioning may have already changed by Friday.
Do I need a paid tool?
No. The TradingView COT indicator is free to use and shows you net positions directly in the chart. CFTC raw data and historical downloads are also freely accessible. Paid tools offer additional comfort like automatic alerts or extended filter options but are not necessary for weekly analysis.
Which report should I use as a beginner?
The Legacy Report, Futures Only, Short Format. It is the easiest to read, contains all relevant columns, and the three groups (Commercials, Non-Commercials, Non-Reportables) are clear and intuitive. Once you read the Legacy Report confidently, you can switch to the Disaggregated Report or TFF if needed. You can find the basics of the three groups in the COT Report Explained article.
In our mentoring program, you'll learn these concepts in over 1,500 video lessons with real chart examples. The macro module shows you how to connect the weekly COT check with macroeconomic analysis and orderflow trading, a complete workflow from the CFTC website to the concrete trade.