Volume Profile Trading: POC, Value Area and VWAP Explained
A Volume Profile plots traded volume by price, not by time. It doesn't show you when trading occurred, but where. Exactly where institutions actually built positions. If you want to understand how Order Flow Trading works in practice, the Volume Profile is your most important analytical tool. As an institutional trader, I was evaluated based on the Volume Profile. It was the basis for my entire performance assessment.
Note: Trading futures and other financial instruments involves significant risks and is not suitable for everyone. The concepts described here are for educational purposes and do not constitute investment advice. You can lose more than your capital deployed.
What a Volume Profile Shows That Candles Can't
Candles show you price over time. A Volume Profile flips this perspective: it shows you volume at each individual price level. A Volume Profile is nothing more than volume plotted by price, no longer by time but by price. This sounds simple, but this change in perspective changes everything.
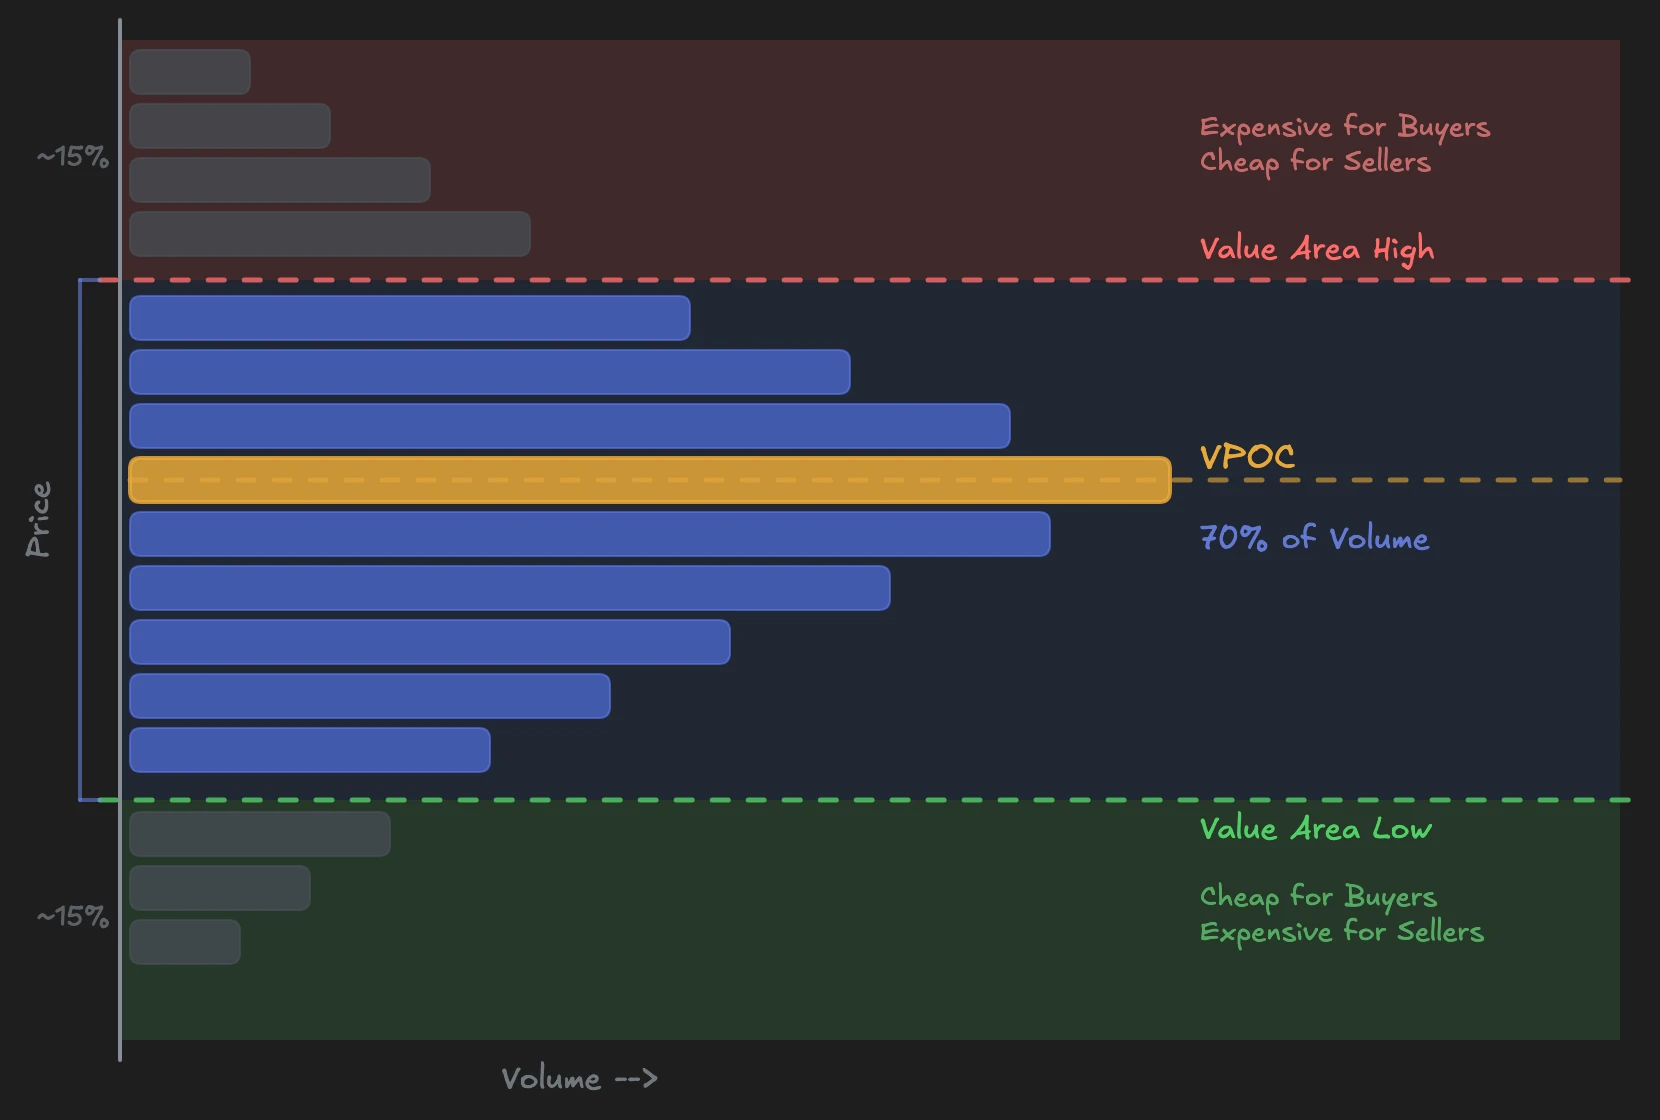
Three components define every Volume Profile:
- VPOC (Volume Point of Control): The price level with the most traded volume. Here the market found the greatest consensus.
- Value Area High (VAH): The upper boundary of the range where approximately 70% of volume was traded.
- Value Area Low (VAL): The lower boundary of this range.
The 70% is not an arbitrary value. Mathematically, one standard deviation equals 68.2% of data. Trading software rounds to 70% because it's easier to program. No matter how the day ends: when the profile is complete, the 70% is always exactly 70%. The math behind it is very precise.
Why this matters: The Volume Profile shows you where consensus existed (high volume) and where the market rejected prices (low volume). It gives you a map of institutional activity, not price development.
Cheap and Expensive Prices: Why the Market Returns to the Value Area
Above Value Area High is expensive for buyers and cheap for sellers. Below Value Area Low is cheap for buyers and expensive for sellers. This is not an opinion, it's statistics. Above the first standard deviation, it's always expensive.
The institutional logic behind this: those who move markets only look at how to get the best average prices. It doesn't matter to get the best price because that's 0.3 to 1 percent of total liquidity. It doesn't matter. It always comes down to the average price.
When price falls below the Value Area Low, institutions load up. They buy aggressively because prices are statistically cheap. This is called "Loading the Boat": buy as much as possible because the average price is massively improved.
When price rises above Value Area High, buyers hold back and sellers enter. Here and there a good trade happens because price comes back and trades within the 70% again. This is not a secret, it's pure math: the remaining 30% of volume is split between zones above and below the Value Area, so about 15% each. Trading is significantly less there because the price is unattractive for the majority of market participants.
I was evaluated exactly as an institutional trader: how efficient was my average price in relation to the day's Volume Profile? There was an evaluation function that validated whether I was a good or bad trader. That's how institutions are evaluated.
What Happens When Institutions Don't Respond
Outside the Value Area, institutions should come in. When they hit, that confirms the logic: the market returns to the Value Area. But if they don't come in, that says something about the coming move. This absence is one of the strongest signals in order flow. If buyers don't buy at cheap prices, nobody wants to buy. The direction is clear.
The Three Structures You Recognize in Volume Profile
Every Volume Profile tells a story about the battle between buyers and sellers. Three structures are critical. If you can read them, you understand where pressure is building and where the market is preparing its next move.
Bellies (High Volume Nodes)
A belly in the profile shows a price range where a lot was traded. The bigger the belly, the more must have been traded there. There was a battle. Buyers and sellers neutralized each other at this level.
Why this is relevant for you: when price returns to a previous belly, the market participants trapped there react. 50% were long, 50% were short. The losers must cover, and that creates predictable pressure. Previous bellies are future reference zones.
Valleys (Low Volume Nodes)
A valley is the opposite: a price level where little was traded. Market participants, buyers as well as sellers, didn't agree that the price was interesting. Either price moved through quickly or was firmly rejected.
In slower markets, valleys work particularly well as rejection zones. When price hits a valley and no new volume appears there, the probability of rejection is high. But in fast markets, a valley can also be a sign that price simply slipped through. Context decides: speed and volume on approach to the valley tell you whether rejection or breakout is more likely.
VPOC Shift
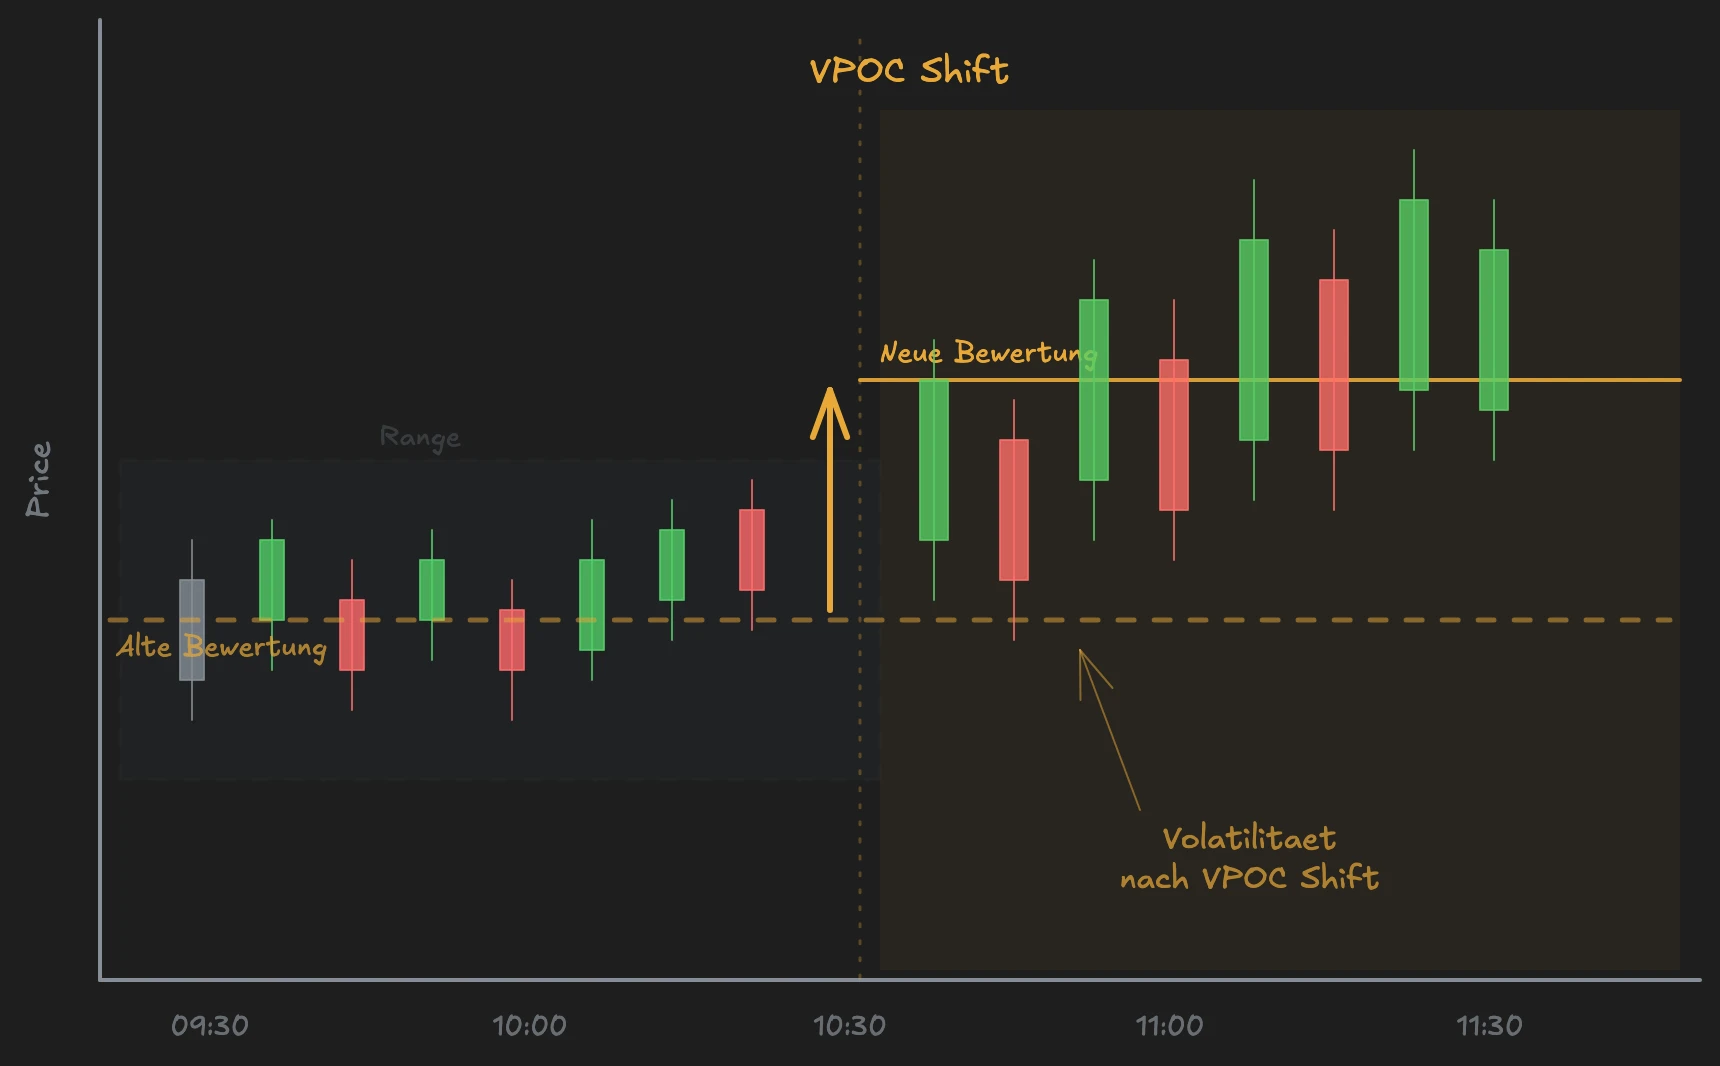
The VPOC Shift is one of the most underrated signals in intraday trading. Every time the VPOC shifts, volatility can occur. Because a new valuation becomes possible.
The institutional logic: when the VPOC shifts up, buyers who previously bought too expensively suddenly get better average prices. They can step on the gas again. The same applies inversely to sellers with a shift down. Eventually the VPOC shifts, and suddenly one side gets a better price again. Combined with a range breakout, the VPOC Shift becomes a directional confirmation signal.
Daily vs Composite Profile: Which Profile When?
For intraday trading, the Daily Volume Profile is the primary tool. It shows you the valuation of the current day and gives you the most relevant reference points for your trading session. You immediately see where today's consensus lies and where institutional activity occurs.
Composite Profiles over multiple days are more suitable for swing traders who want to analyze a higher-level structure. A Composite Profile aggregates volume from several sessions and shows you broader zones of acceptance and rejection. If you create a 5-day Composite, for example, you see where the market found the most consensus over the entire week. These broader zones function as stronger support and resistance levels because more market participants are positioned there.
For daily work on order flow, the Daily Profile is sufficient. Comparing Value Areas of consecutive days additionally gives you a directional bias: if the Value Area shifts up, the market is long-biased. If it shifts down, short-biased. This principle is simple and simultaneously one of the strongest tools I know. It comes directly from statistics: if 70% of all trades happen at higher levels from day to day, the mass shows you where the journey is heading.
VWAP: The Dynamic Volume Profile
The VWAP (Volume Weighted Average Price) is fundamentally the same concept as the Volume Profile, just calculated in real time. Instead of a finished profile at the end of the day, you get a running volume-weighted average price. Above the VWAP, the market is long-biased; below, short-biased.
There are various VWAP variants: the Daily VWAP, the EU Session VWAP and the US Session VWAP. Each forms its own reference point for the respective trading period.
The institutional background makes VWAP particularly relevant: especially in NQ trading, VWAP is central because almost all institutional algorithms run based on VWAPs. They are programmed to do so. When an algorithm executes orders, it ориентируется on the volume-weighted average, not moving averages or RSI.
But there is a crucial difference between standard VWAP and what institutions really use. An Anchored VWAP starts exactly when the institution enters. It doesn't start at midnight or session start, but exactly at the starting point of the institutional campaign. Finding the exact anchor point is the real difficulty. But if an institution collects for an hour, it leaves traces. In the Footprint Chart, you can recognize this activity and narrow down the anchor point.
This Multi-VWAP concept is something most traders don't know. The Daily VWAP alone is not enough. Only when you understand that different VWAPs represent different groups of market participants can you really read who is currently active. The EU Session VWAP shows you how European institutions valued the market. The US Session VWAP shows you the same for the American session. When both VWAPs point in the same direction, you have a strong bias. When they diverge, the market is still undecided.
FAQ: Volume Profile
Is the Volume Profile an entry signal?
No. The Volume Profile provides you with context: where are cheap prices? Where is consensus? Where should institutions respond? But the actual entry comes from order flow confirmation at these levels. In the Footprint Chart, you see whether aggressive buyers are actually active at a VAL level. And through Big Trades, you recognize whether the large market participants are really entering. The Volume Profile tells you where you should trade. The order flow tells you when to enter. Without this combination, you're always missing half the picture. Many beginners make the mistake of buying directly at the Value Area Low just because price is "cheap" there. But without confirmation from order flow, you don't know whether institutions are actually entering or whether price will continue falling.
Does Volume Profile work for crypto and forex?
The concept works on any market that provides reliable volume data. On futures like ES, NQ or Gold, you get real exchange data from the CME, and the Volume Profiles are correspondingly meaningful. On forex and crypto, volume is fragmented depending on the data provider because there is no central order book. The profiles can still be useful, but the accuracy is not comparable to regulated futures markets.
What software do I need for Volume Profile analysis?
For professional Volume Profile analysis, you need software that processes real tick data. We work primarily with ATAS because it offers the strongest options for Footprint Charts, Delta Profiles and Volume analysis. TradingView now has a built-in Volume Profile that suffices for getting started. The platform matters less than understanding what you're seeing. You can find a detailed comparison of the most important tools in our Order Flow Software Comparison.
In our mentoring program, you'll learn these concepts in over 1,500 video lessons with real chart examples. The NQ Masterclass dedicates 10 lessons to the Volume Profile alone, and the Bootcamp shows you step by step how to use Daily Profiles and VWAP logic in practice.