Macroeconomics for Traders: The Economic Data That Moves Markets
Most day traders ignore macroeconomics. They analyze charts, study order flow, read footprint data. But they trade without understanding WHY the market moves. Macro data doesn't move markets directly. It moves expectations about interest rates, which move bonds, which move everything else. During my time as an institutional trader, I executed orders, not analyzed macro data. That was the job of the research department, the analysts, the strategists. But that exactly shows the point: the institution as a whole doesn't make a single decision without macro context. As a retail trader, you are institution and analyst in one person, so you need to be able to do both. This article shows you the complete framework: from Fed policy to your NQ trade.
Risk Warning: Trading futures and other financial instruments involves significant risk and is not suitable for everyone. You should only trade with capital you can afford to lose. Past performance is no guarantee of future results.
Why Macroeconomics Matters for Day Traders
Most retail traders dismiss macroeconomics as irrelevant for day trading. That is a mistake.
Every sharp intraday movement on a data release day originates in macroeconomic expectations. When CPI numbers are released and the NQ drops 100 points in seconds, the market is not reacting to a number; it is repricing interest rate expectations in real time.
The hierarchy is clear and unchangeable: Fed Policy → Bond Market → Stock Markets → Individual Instruments. Everything flows from top to bottom. Who only looks at the lowest level (their individual trade) misses the forces that move it.
A concrete example: CPI comes hotter than expected. The consequence chain is immediately activated. Higher inflation means the Fed must keep rates higher for longer. The 10-Year Treasury Yield spikes. NQ sells off because higher rates put pressure on growth stock valuations. This happens in seconds, but the logic behind it takes months to truly understand.
The institutional context makes it clear: no big institution trades without macro context. The analysts and strategists deliver the macro briefing before a single trade is placed. Bond yields, economic calendar, Fed speaker dates, everything is prepared. As a retail trader, you have to create this context yourself.
"Macroeconomics is not a trading system; it is the context in which every trading system works or fails. Who trades without understanding macro navigates blindly."
— Marco Bösing, founder of United Daytraders
If you are just starting with futures trading, you should first familiarize yourself with the basics of futures trading before diving into macro data.
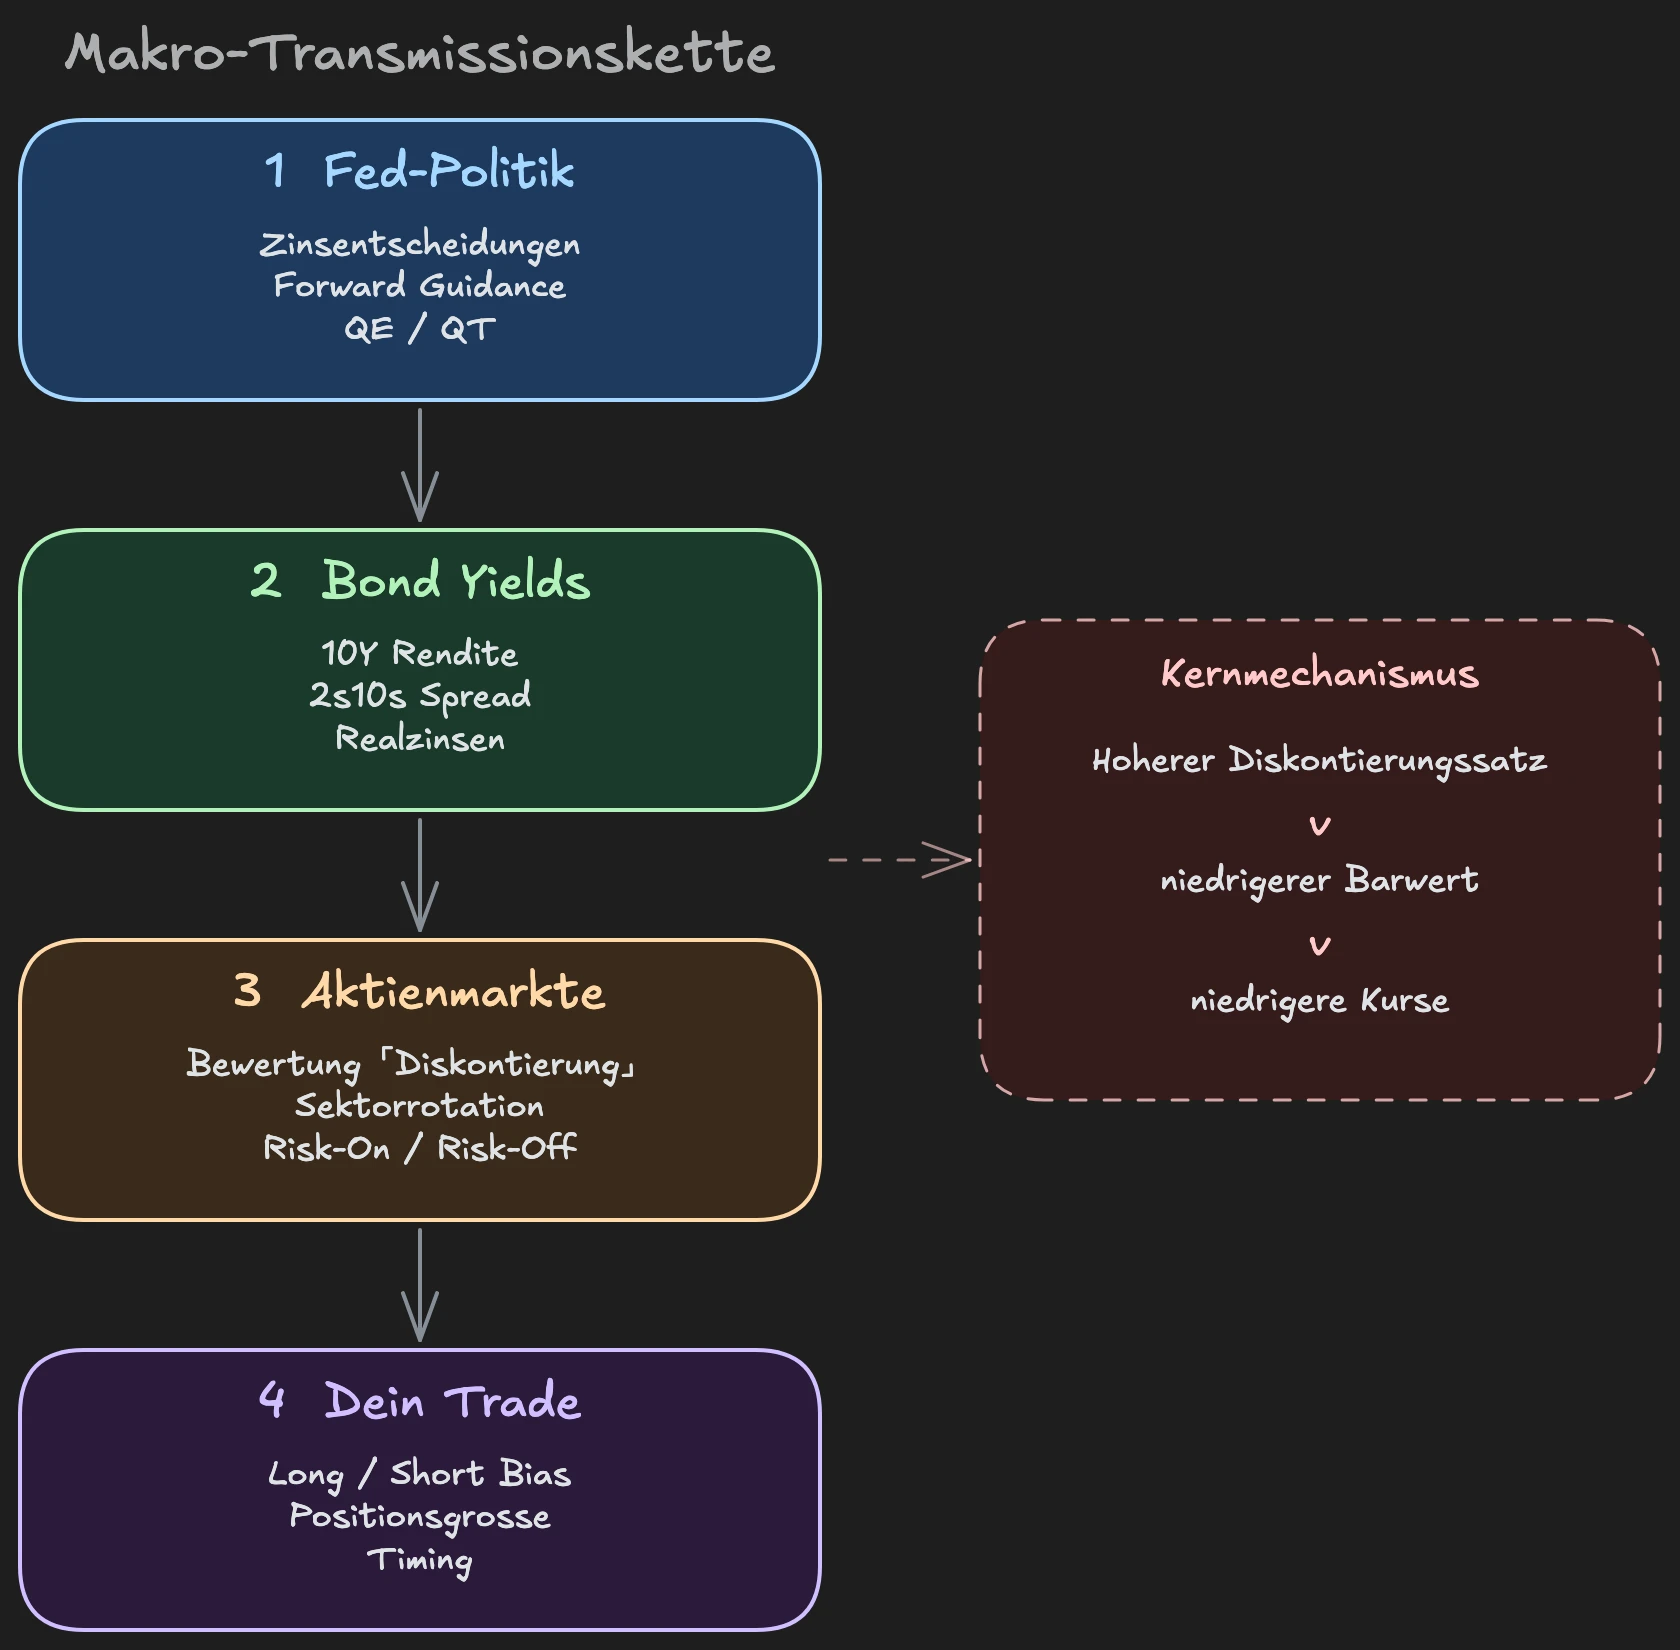
The Transmission Chain: How Macro Data Moves Markets
Understanding the transmission chain is the key to everything that follows. Most traders only see the end effect (NQ drops after CPI release) but don't understand the mechanics behind it. The chain has four stages, and each builds on the previous one.
Stage 1: Fed Policy
The Federal Reserve sets the Federal Funds Rate, the interest rate at which banks borrow money overnight. This is the foundation of all financial markets. When the Fed raises rates, credit costs rise for the entire economy. When it lowers rates, money becomes cheaper and flows into riskier assets.
But the Fed doesn't react arbitrarily. It follows its dual mandate: price stability and maximum employment. Every macro release is viewed through this lens: does this number bring us closer to a rate hike or a rate cut?
What matters for traders: not current Fed policy moves markets, but changes in EXPECTATIONS about future policy. When the market prices in three rate cuts by year-end and a strong jobs report reduces this expectation to two cuts: that is the moment when markets move. The actual rate decision months later is already priced in.
Stage 2: Bond Market
The bond market is the largest financial market in the world and the smartest. Bond traders price economic realities long before stock traders wake up. The 10-Year Treasury Yield is THE number that influences everything else. It reflects market expectations for growth, inflation and Fed policy over the next decade.
When a CPI release comes in higher than expected, bonds move first. Yields rise (bond prices fall) because the market prices higher rates for longer. This happens in milliseconds, algorithmically driven, but fundamentally justified.
The bond market is also relevant because it is enormously large. Daily trading volume in the US Treasury market exceeds that of the entire US stock market. When Smart Money changes its view on the economy, you see it first in bonds, not stocks. That is why the 10-Year Yield should be required reading for every day trader before opening their first stock chart.
Stage 3: Stock Markets
Every asset is valued relative to the risk-free interest rate. The 10-Year Yield IS this benchmark. Rising yields mean a risk-free investment becomes more attractive, which puts pressure on the valuations of risky assets.
Particularly affected: growth stocks and technology, exactly the stocks that dominate the Nasdaq. Their valuations are based on future cash flows that are discounted more heavily when rates rise. That is why NQ is more sensitive to interest rate changes than ES.
A practical example: when the 10-Year Yield jumps from 4.20% to 4.35% in a day (a rise of 15 basis points), NQ typically loses 1-2%. That sounds like little, but in Micro-NQ contracts, that quickly becomes several hundred dollars per contract. The mechanism is mathematical: higher discount rate → lower present value of future earnings → lower stock prices.
Stage 4: Your Trade
Everything comes together here. An NQ long setup during a hot CPI release with rising yields is a trade against the macro current. The order flow signal may be perfect, but you are swimming against the tide. Macro is the ultimate filter.
The most important insight: when bonds are selling (yields rising) while stocks are simultaneously rallying, the stock rally is living on borrowed time. This divergence always resolves, and almost always in favor of the bond market.
The Big 5: The Most Important Economic Data for Traders
Every month, dozens of economic data points are released. Most are noise. For day traders, particularly in NQ, there are five releases that really matter. These Big 5 explain the majority of all macro-driven market movements.
NFP (Non-Farm Payrolls)
What: The monthly employment report from the Bureau of Labor Statistics. Contains the number of new jobs created (outside agriculture), the unemployment rate and average hourly wages.
When: First Friday of the month, 2:30 PM CET.
Why it matters: The employment situation is the most direct measure of economic health. More jobs mean more consumer spending, more growth, and potentially more inflationary pressure from rising wages. The Fed watches the labor market obsessively because it directly touches their mandate.
NQ Impact: NFP is one of the most volatile days of the month. The deviation from consensus matters, not the absolute number. 200,000 new jobs with expectations of 180,000 is a non-event. 200,000 with expectations of 120,000 moves markets massively. The first reaction is often wrong. Experienced traders wait for the initial volatility and only trade the follow-up movement after 15-30 minutes.
Particularly important: the Average Hourly Earnings within the NFP report are often underestimated. Rising wages are an early indicator of inflation, and inflation is what the Fed fears most. An NFP report with moderate jobs but strongly rising wages can hit NQ harder than a report with above-average new jobs. A detailed strategy for NFP days can be found in the article NFP Trading.
CPI (Consumer Price Index)
What: The Consumer Price Index, published by the Bureau of Labor Statistics. Measures price development of a basket of goods. Traders focus on Core CPI (excluding food and energy) because those are too volatile.
When: Around the 12th of the month, 2:30 PM CET.
Why it matters: Inflation is the central topic for the Fed. As long as inflation remains above the 2% target, the pressure for higher rates remains. CPI is the most direct indicator of whether the Fed MUST continue its restrictive policy.
NQ Impact: After FOMC, CPI is the most volatile data point for NQ. A hot CPI print (above expectations) pushes NQ down because it implies higher rates for longer. A cool print (below expectations) can trigger massive rallies because it brings rate cuts closer.
Traders should particularly watch the monthly rate (MoM) of Core CPI, not just the yearly rate (YoY). The yearly rate moves sluggishly; it changes by 0.1 percentage points. The monthly rate shows the current trend and is what the market reacts to most strongly. A Core CPI MoM of 0.4% instead of the expected 0.3% can push NQ down 150+ points.
FOMC (Federal Open Market Committee)
What: The Fed's monetary policy decisions. Includes the rate decision, the Dot Plot (Fed members' rate forecasts) and the subsequent Fed Chair press conference.
When: Eight meetings per year. Rate decision at 8:00 PM CET, press conference at 8:30 PM CET.
Why it matters: The Fed sets the course for global financial markets. But: the actual rate decision is usually priced in weeks in advance. The surprise comes from the tone (hawkish vs. dovish) and from the Dot Plot, which shows where Fed members see rates in 1-3 years.
NQ Impact: FOMC days are among the most volatile of the year. The initial reaction to the rate decision is often a fake move. The real direction is set during the press conference when the Fed Chair delivers nuances that algorithms can't parse immediately.
A typical FOMC pattern: at 8:00 PM CET, the rate decision comes and NQ moves 50-80 points in one direction. At 8:30 PM CET, the press conference begins and the market completely reverses. The Fed Chair uses a single word differently than expected, and the entire narrative shifts. That is why most professional NQ traders don't trade FOMC directly but wait for the following day when the dust has settled.
GDP (Gross Domestic Product)
What: The gross domestic product, the total economic output. Published quarterly in three estimates (Advance, Second, Third). Backward-looking, but the Atlanta Fed GDPNow tracker provides real-time estimates.
When: Quarterly, about one month after quarter end. A detailed explanation of how to use the GDPNow tracker practically can be found in the article GDP Nowcast in Trading.
Why it matters: GDP alone is a lagging indicator. But GDPNow changes the game. When the GDPNow estimate swings dramatically (for example, from +2.5% to +0.5% within a few weeks), sentiment shifts noticeably. Suddenly the market prices in recession risks.
NQ Impact: Official GDP releases moderately move NQ unless they deviate strongly from expectations. GDPNow updates, on the other hand, can shape the narrative over weeks and set the base tone for markets. When GDPNow falls from +3.0% to +0.8%, for example, traders begin pricing in recession scenarios even before official GDP is published. This tracking transforms GDP from a lagging to a quasi-leading indicator.
PMI (Purchasing Managers' Index)
What: The ISM Manufacturing and ISM Services Index. Based on surveys of purchasing managers about orders, production, employment and delivery times.
When: ISM Manufacturing on the first business day of the month, ISM Services on the third business day. Both at 4:00 PM CET.
Why it matters: PMI is a leading indicator: it shows what IS COMING, not what was. Above 50 means expansion, below 50 contraction. The direction and speed of change matter more than the absolute number.
NQ Impact: ISM Services often carries more weight for NQ than ISM Manufacturing because the US economy is service-dominated. A surprisingly weak services PMI can trigger recession fears and put pressure on NQ.
When trading around these events, solid risk management is not optional but survival-critical. Position sizing and stop management become the most important tool on data days.
The Bond-Stock Connection
The relationship between bonds and stocks is the most important concept in macroeconomics for traders. A detailed deep dive into bonds, yields and their influence on your trading can be found in the article Interest Rates and Bonds for Traders. If you take only one thing from this article, it is this: Understand the 10-Year Treasury Yield.
The logic is direct: yields rise → NQ gets headwinds. Yields fall → NQ benefits. This is not correlation; it is causality. Rising yields mean the risk-free rate rises, which puts pressure on valuations of all risky assets. And NQ, loaded with highly valued tech stocks, is the most sensitive instrument.
This relationship works in both directions. In phases of falling yields (when the market expects rate cuts), NQ can stage massive rallies even if fundamental company data has hardly changed. Valuation rises because the discount rate falls. This explains why stocks sometimes recover even when the economy is weak: weak economic data → Fed cuts → yields fall → stocks rise. The famous "bad news is good news" dynamics.
Three bond metrics should be on every trader's radar:
10-Year Treasury Yield: This is the one number. Watch it via /ZN (10-Year Treasury Note Futures) or TradingView (US10Y). When the 10-Year Yield rises 10+ basis points in a day, NQ almost certainly has a difficult day. This correlation rarely breaks, and when it breaks, that itself is a signal.
2s10s Spread: The difference between the 2-Year and 10-Year yield. When the 2-Year is higher than the 10-Year (inverted yield curve), that signals an approaching recession. But caution: the recession typically doesn't start during the inversion but when the curve normalizes again. The normalization after an inversion is historically the stronger warning signal.
Real Yields: Nominal yields minus inflation expectations (Breakeven Inflation Rates). Negative real yields are bullish for risk assets because they mean cash is losing real value. Investors are pushed into riskier assets. Positive and rising real yields are the opposite: they make safer assets attractive and draw capital from the stock market.
The most important filter for your trading day: when bonds are selling (yields rising) while stocks are simultaneously rallying, the stock rally is fragile. This divergence is one of the most reliable warning indicators. Conversely: when yields fall and stocks rise, you have tailwind from the world's largest market.
To understand the Nasdaq futures market in detail, read our guide to Nasdaq Futures. And if you want to expand your technical toolkit, our article on Volume Profile Trading shows you how to identify institutional price levels.
Using Macro Data in Daily Trading
Macroeconomics doesn't have to be complex. Integrating it into your daily workflow takes 10 minutes, not more.
Morning Prep (10 minutes): Before opening a single chart, check three things: Where are overnight bonds (10-Year Yield vs. prior day)? What is on the economic calendar today? Are Fed speakers speaking today? This literally takes 10 minutes and gives you context for the entire day. Make a note: Did bonds rise or fall overnight? Did anything change in Asia or Europe that could affect US open? A simple note ("Yields +5bps overnight, CPI today at 2:30 PM, no Fed speaker") suffices as a macro briefing.
Bias Filter: Macro doesn't provide entry signals. It provides a direction, a bias. When the 10-Year Yield has been rising for three days and the dollar is getting stronger, you have a macro bias short for NQ. This doesn't mean you go short blindly. It means you evaluate long setups more critically and prefer short setups.
Data Day Rules: On days with high-impact releases like NFP, CPI or FOMC, different rules apply. 15 minutes before and after the release: no new trades. The initial reaction is often a fake move, algorithmically driven, not yet digested. Reduce position size by at least 50%. Widen your stops to survive the increased volatility.
Conflict Filter: This is where macro becomes really powerful. Your order flow shows a long setup, but the 10-Year Yield is just spiking up. That is a conflict, and conflicts mean: do not trade. Wait until one of the signals resolves. Conversely: order flow long and falling yields? That is confluence; your setup has macro tailwind. The conflict filter alone can dramatically improve your hit rate because it keeps you out of trades that swim against the macro current.
Weekly Macro Review: Every Sunday evening, 15 minutes: What data is coming next week? How does the bond market price the week? Are there trend changes in GDPNow? Is the Fed Chair speaking? These 15 minutes on Sunday save you surprises during the week. How to use the economic calendar properly is shown in our separate guide.
No large institution starts the day without a macro briefing. At the banks and prop desks where I worked, the briefing came from the research department before the first trade. As a retail trader, you have no analysts doing this for you. But 10 minutes are enough to create the same context for yourself. The question is not whether you can afford these 10 minutes. The question is whether you can afford not to do it.
If you want to understand how to combine macro context with precise entry techniques, read our deep dive on Order Flow Trading.
The Most Common Mistakes in Macro Trading
Integrating macro into trading is simple. Getting it wrong is also simple. Here are the five most common mistakes.
Mistake 1: Using macro data as a trading signal. CPI comes hot → short NQ. It is not that simple. The reaction depends on what the market EXPECTED. If the market already priced in a hot CPI, a hot print can lead to a rally because it wasn't hot ENOUGH. More often: headline CPI is hot but Core CPI comes in cooler, and the market rallies because Core is what the Fed really watches. Macro provides context, not signals.
Mistake 2: Following everything simultaneously. Durable Goods Orders, Industrial Production, Housing Starts, Consumer Confidence. There are dozens of releases. Most are noise. Focus on the Big 5 (NFP, CPI, FOMC, GDP, PMI) and ignore the rest. Less information, processed better, beats more information, poorly digested.
Mistake 3: Macro without timeframe. Macro data works on weekly and monthly timeframes. A GDP release from last week is not a reason to take a scalp today. Macro shapes the bias over days and weeks. For individual trades, you need technical analysis and order flow.
Mistake 4: Ignoring expectations. The absolute number is irrelevant. What matters is the deviation from consensus. 250,000 new jobs sounds strong, but if the market expected 300,000, it is a disappointment. Before every release: check consensus. The surprise component moves markets, not the number itself.
Mistake 5: Full position size through events. Even experienced traders reduce their position size by 50-75% on high-impact days or go completely flat. The volatility around data releases is not the same as on normal days: spreads widen, slippage increases, stops get run. A stop-loss that normally triggers at 10 points can fill at 25 points with slippage during CPI. Full position through a CPI release is not trading; it is gambling. The risk-reward ratio flips against you, no matter how good your setup is.
Understanding Macro Without an Economics Degree
You don't need a degree in economics. You need five relationships that you understand and regularly observe.
1. Employment → Consumption → Growth. More jobs mean more income, more spending, more economic growth. And growth means: the Fed has less reason to cut.
2. Inflation → Interest Rate Expectations → Bond Yields. Rising inflation forces the Fed to keep rates high or raise them further. Bond traders price this immediately; yields rise.
3. Bond Yields → Stock Valuations. Rising yields pressure valuations, especially for growth stocks. Falling yields support valuations. NQ is the most sensitive barometer.
4. Fed Policy → Short-term Rates → Everything. The Fed sets the tone. Everything else reacts to it. When the Fed is hawkish, short-term yields rise, the dollar strengthens, stocks get headwinds.
5. Strong Dollar → Headwinds for Multinational Companies. A rising dollar makes US exports more expensive and pressures dollar-denominated foreign earnings. Many NQ heavyweights (Apple, Microsoft, Alphabet) generate roughly 50-65% of their revenues outside the USA. When the Dollar Index (DXY) rises while the Fed stays hawkish, that is double headwind for NQ, and a factor that many day traders completely overlook.
Practical resources for daily use:
- Investing.com Economic Calendar: All releases with consensus, prior value and actual. Filter by high impact.
- TradingView US10Y: 10-Year Treasury Yield as a permanent chart. One tab that always stays open.
- CME FedWatch Tool: Shows market expectations for next Fed decisions in percentage. When the market prices in 85% probability of a rate cut and it doesn't happen, you immediately understand the reaction.
The goal is not to predict the economy. The goal is to understand the context in which you trade. 10 minutes a day, the right three tools, and the Big 5 in view. That is all.
FAQ: Macroeconomics for Traders
Do I have to follow macro data as a day trader?
You don't have to trade it, but you have to KNOW it. 10 minutes of morning prep is enough: check bond yields, scan the economic calendar, note Fed speaker dates. This gives you the context to understand why the market moves the way it moves. Without this context, you are reactive all day instead of proactive.
Which economic data is most important for NQ traders?
NFP, CPI and FOMC. These three explain about 80% of macro-driven NQ volatility. PMI and GDP complete the picture, but if you focus on three, focus on these. NFP moves the labor market narrative, CPI moves inflation expectations, FOMC moves monetary policy direction.
Should I close my positions before economic data?
Simple rule: if you can't explain why you are holding the position through the release, flatten it. High-impact events like NFP and CPI generate volatility that can exceed your normal risk management. At least reduce position size and widen stops. Many experienced traders go completely flat and only trade the reaction after the release.
How do I combine macro with order flow?
Macro provides the direction, the bias. Order flow provides the timing, the entry. Macro tells you whether to think long or short today. Order flow shows you where and when to enter. When both point in the same direction, you have confluence. When they contradict each other, you stay on the sidelines.
In our Macroeconomics course with 20 video lessons, you will learn how bonds, interest rates and economic data connect. The course explains the transmission chain from Fed policy through bonds to your NQ trade and shows you how to integrate this information into your daily workflow. At united-daytraders.com, you will find the program alongside over 1,500 video lessons from institutional traders.