How to Read Footprint Charts: Spotting Institutional Activity
A Footprint Chart shows you what a normal candle hides: how many contracts were bought and sold at each individual price level. Instead of just seeing Open, High, Low and Close, you observe the inner battle between aggressive buyers and passive sellers in real time. In our Order Flow Trading Guide, I explained that order flow consists of exactly six elements (Bids, Asks, Market Buys, Market Sells, Limit Buys, Limit Sells). The Footprint Chart makes these six elements visually tangible.
Risk Warning: Trading futures and other financial instruments carries significant risk of loss. Past results are not indicative of future performance. Only trade with capital you can afford to lose.
What a Footprint Chart Shows That Candles Hide
A candlestick shows you the result: price went from A to B. A Footprint Chart shows you the process. You see for each price level within a candle how many contracts were traded on the Bid side and how many on the Ask side.
That is the difference between "price went up" and "at this level, 800 aggressive buyers pushed against 200 limit sellers and won."
Bid, Ask and the Aggressive Side
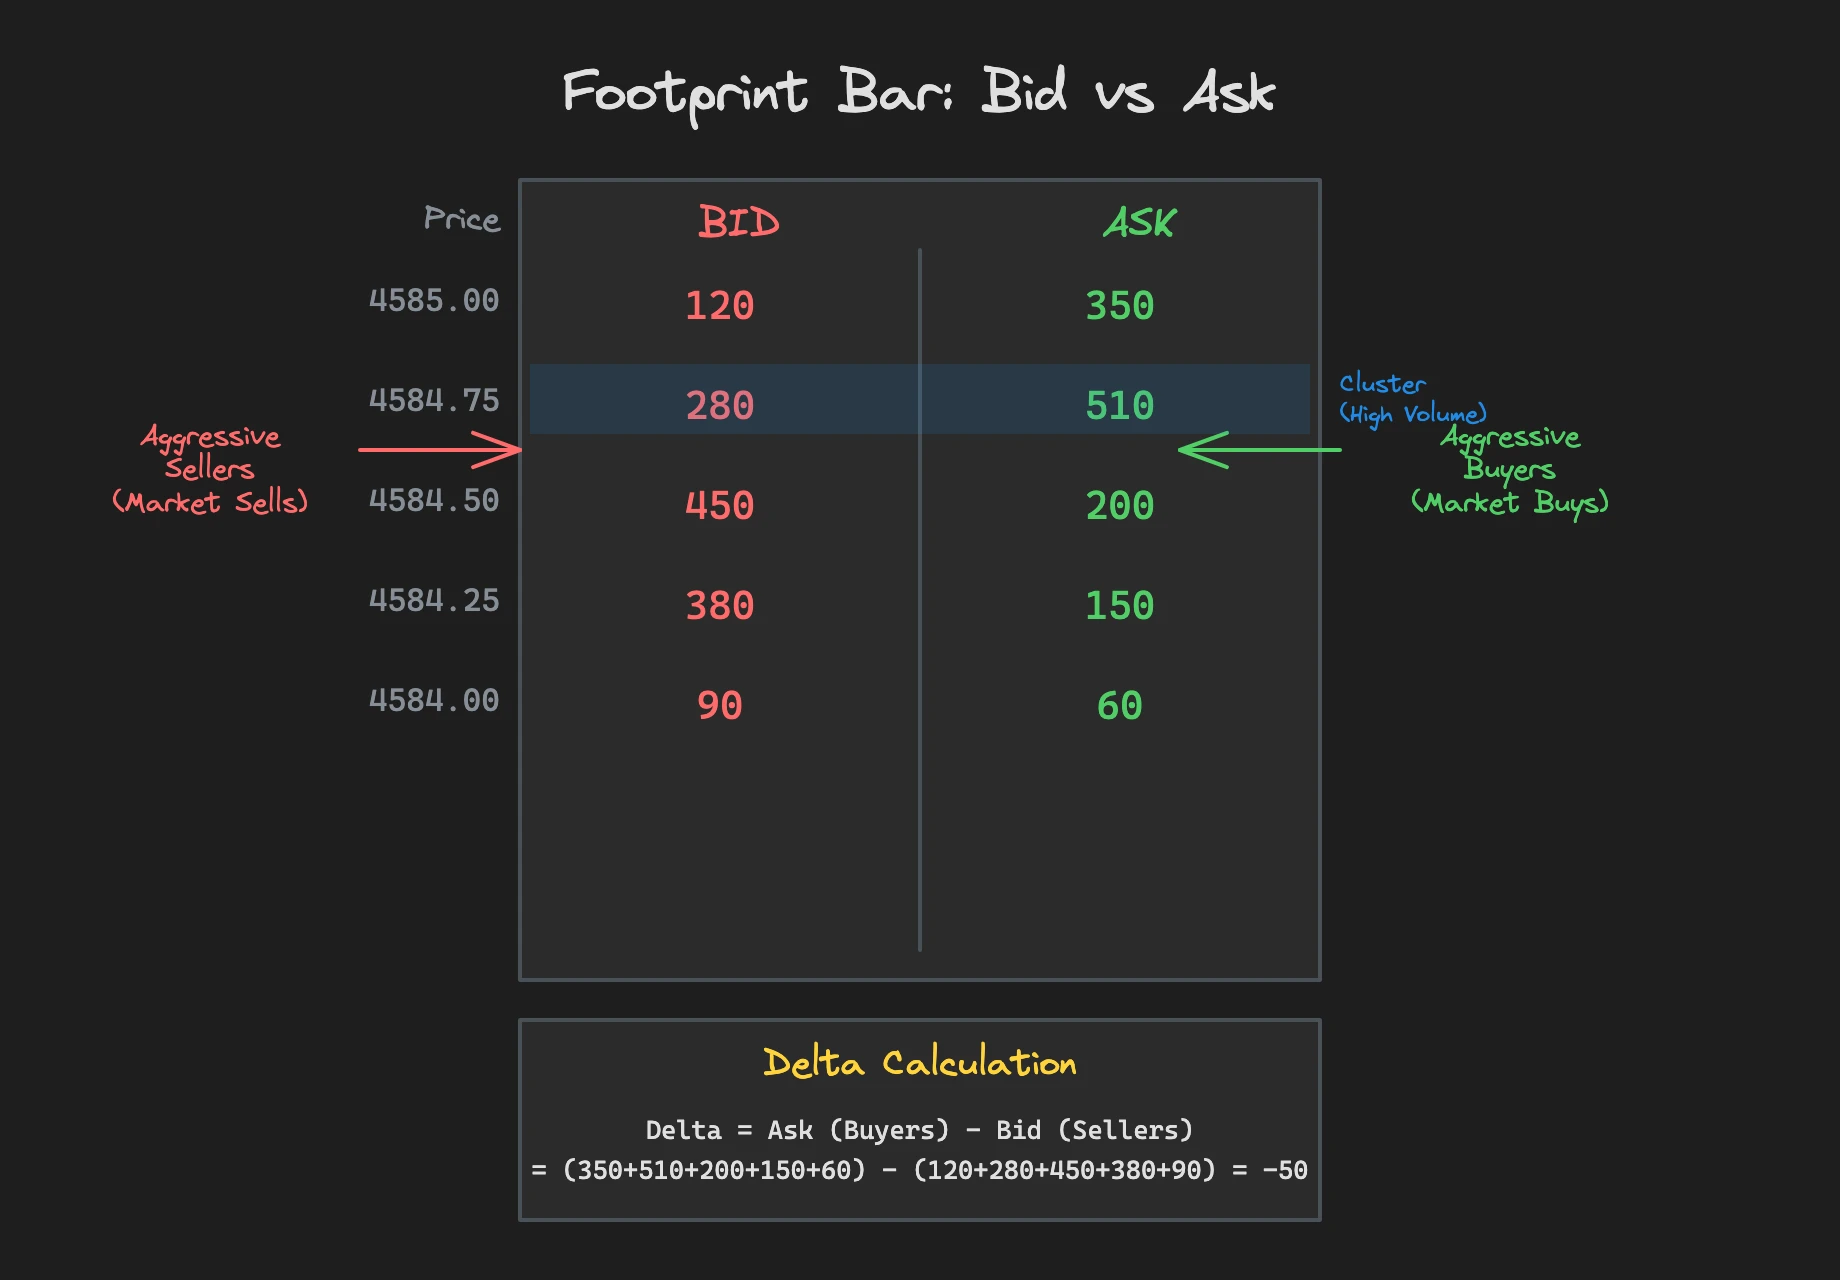
In the Footprint Chart, you see two columns per price level: Bid on the left, Ask on the right. The left side shows you how many contracts hit the Bid. Those are aggressive sellers running with Market Sells into passive Limit Buys. The right side shows you the aggressive buyers lifting the Ask with Market Buys.
This distinction is critical. High numbers on one side alone don't tell you much. The critical question is always: did the aggressive side actually manage to move price? When 500 market buys hit the Ask but price still doesn't rise, then the passive side absorbed that aggression. That is information that no candlestick chart will ever give you.
The Three Things You Look for in Footprint
When you open a Footprint Chart, it's not about analyzing every number at every level. There are three core elements you should focus on: Delta, Clusters and Imbalances. Each of these elements answers a different question about current market activity.
Delta: Who Has Control?
Delta is the difference between aggressive buyers (Ask volume) and aggressive sellers (Bid volume) per candle. Positive delta means more Market Buys occurred. Negative delta shows the seller side was more aggressive.
But delta alone is not a directional statement. A strongly positive delta at a resistance level where price still doesn't rise is a completely different signal than the same delta in the middle of an uptrend. In the first case, you see failed aggression. In the second case, you see confirmation.
The Volume Delta Profile goes a step further. It doesn't just show you where a lot was traded, but who was aggressive at which price level and whether that aggression actually managed to move price. When extreme aggressive buyers can't make price rise, they were absorbed, and that is a direct short implication. Conversely: strong sellers who can't push price down point to a long setup.
Clusters: Where Are the Big Players Fighting?
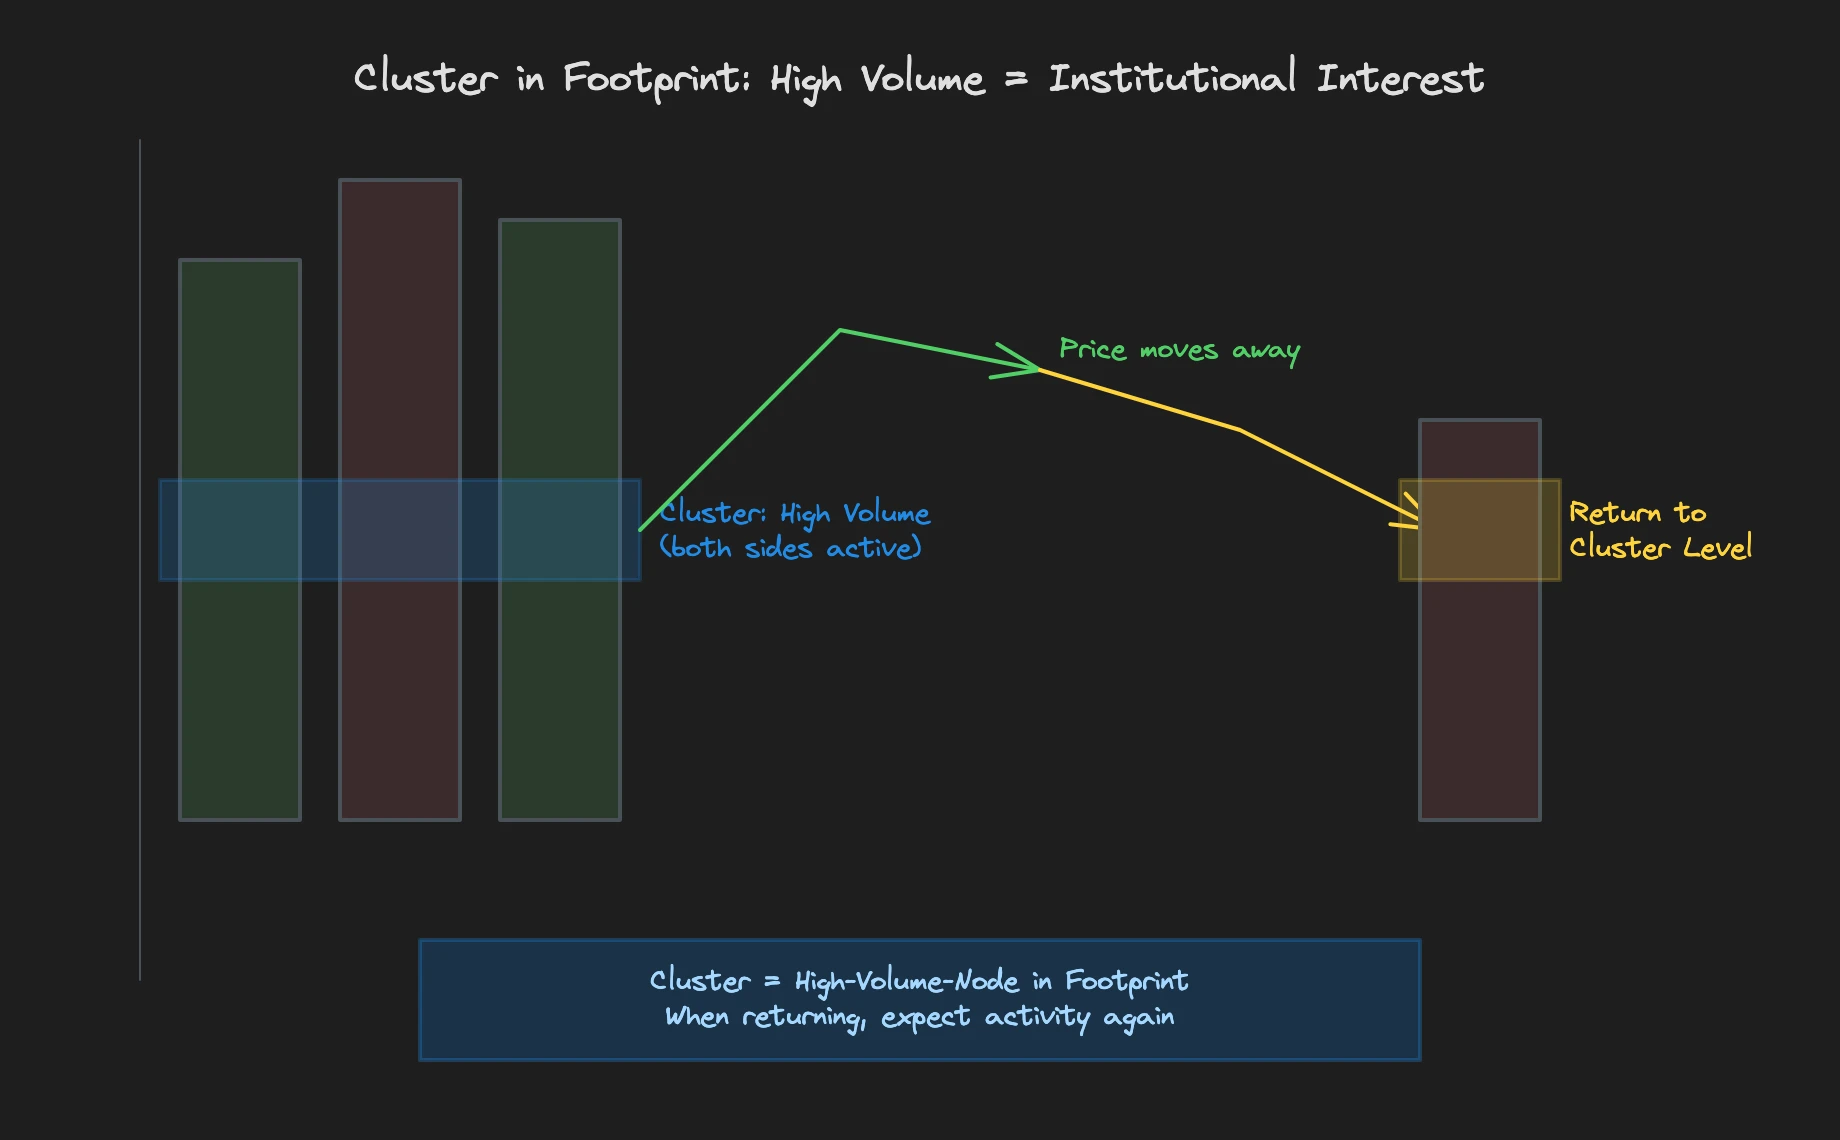
A cluster is a price level within a candle where unusually high volume was traded. That sounds simple, but there's an important detail behind it: a cluster only forms when both sides are active. Only buyers brings nothing, only sellers either. A cluster forms where a buyer met a seller, and both wanted to trade at that price.
If clusters repeatedly form at the same price level, that is a strong signal of institutional relevance. The big players are trading there. And when price moves away from such a level and later returns, you can expect activity there again because these levels didn't form randomly for institutional participants.
Conceptually, a cluster in the Footprint is the same as a High Volume Node in the Volume Profile, just broken down to the timeframe of a single candle. The combination of both gives you a complete picture.
Imbalances: Where Is One Side Pushing Through?
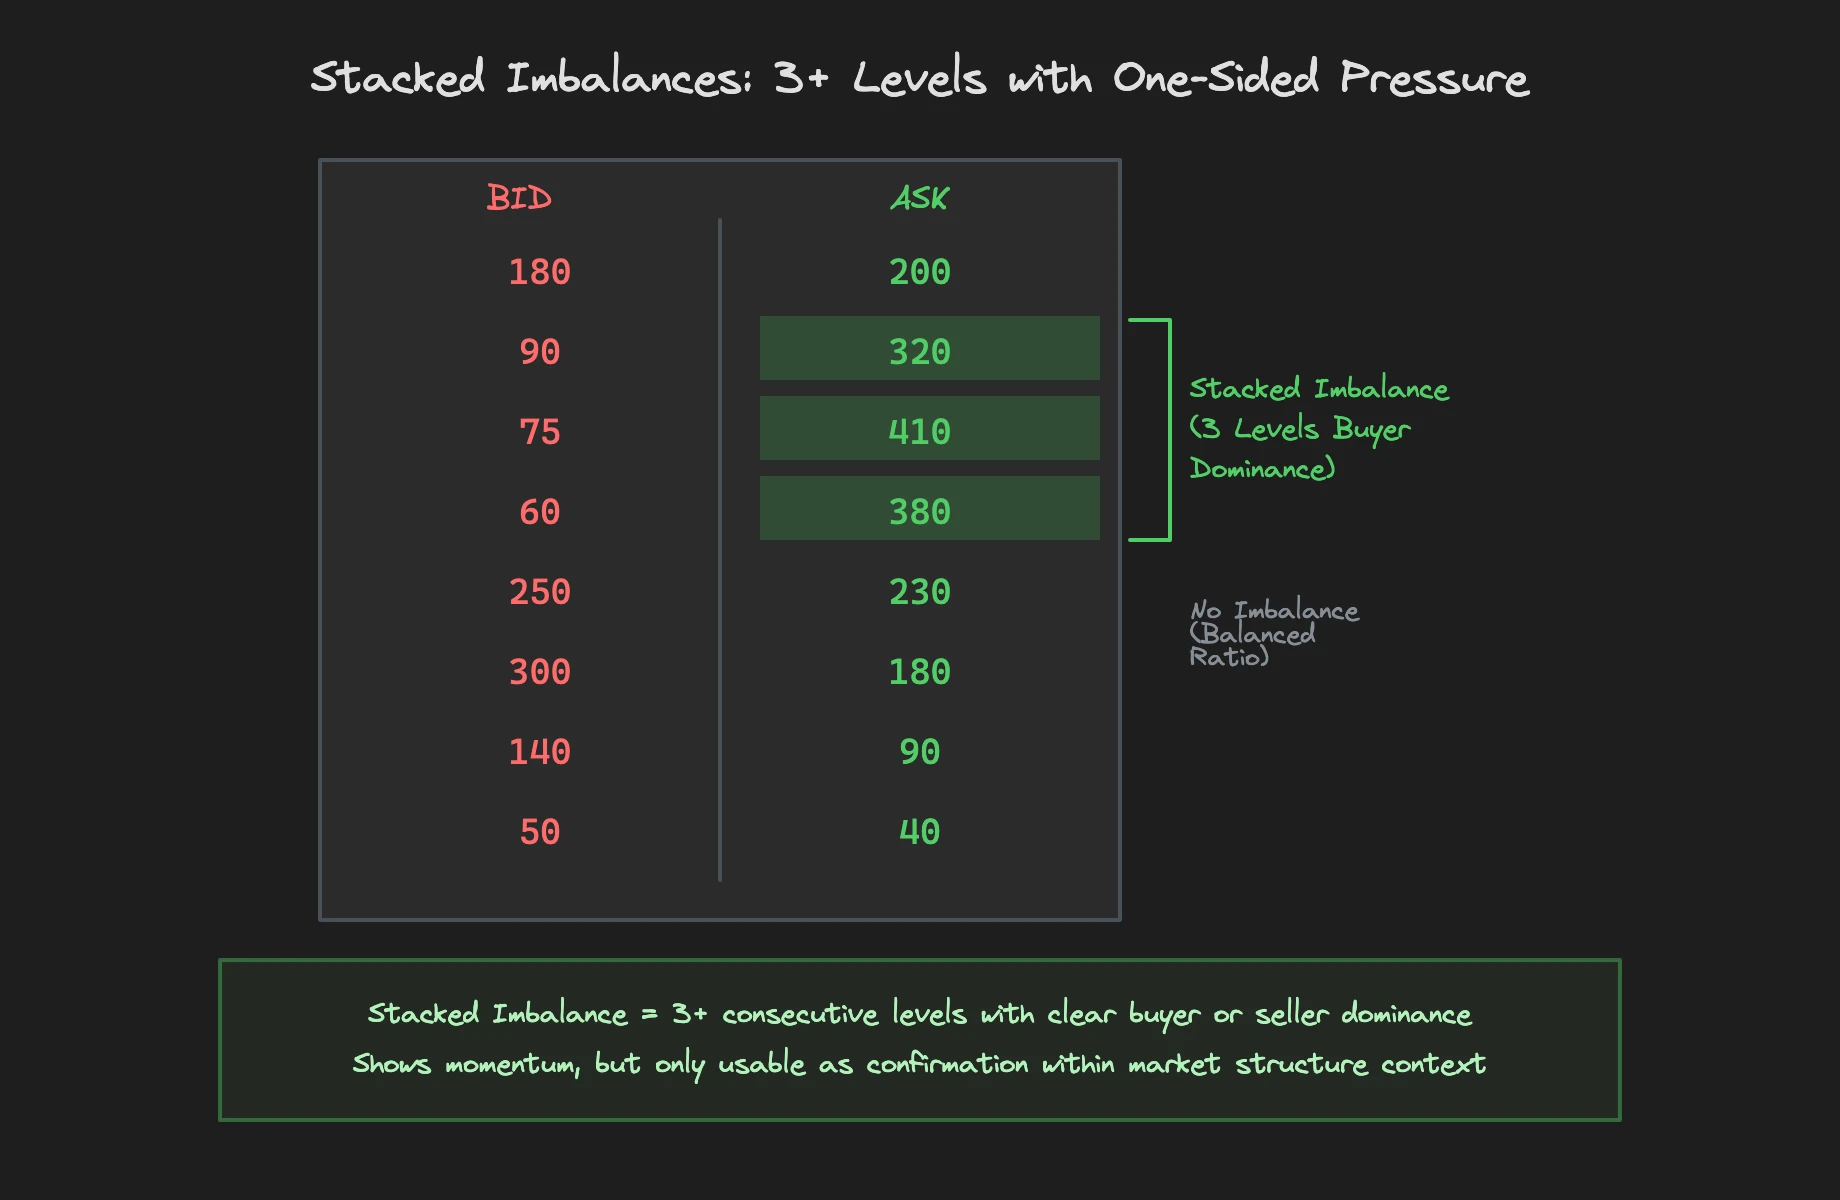
An imbalance occurs when the ratio between Bid and Ask volume at adjacent price levels exceeds a threshold. Unlike pure volume, it's about the ratio. 300 contracts on the Ask with 50 on the Bid is a clear imbalance, regardless of total volume.
Stacked Imbalances are particularly meaningful: when three or more consecutive price levels show the same imbalance direction, one side has taken control over an entire price range. In ATAS, these are automatically marked, making them visible even on normal candlestick charts even if you're not actively working in the Footprint.
An important point about the market: in the NQ (Nasdaq-100 Futures), imbalances appear almost constantly because the order book is thinner than in the ES. The NQ trades around 600,000 contracts per day, while the ES trades over 2 million per day. Therefore, imbalance analysis is significantly more meaningful for the ES (S&P 500 Futures).
Footprint as Confirmation, Not Signal
This is the most important section of this article. The Footprint Chart is a confirmation tool, not a signal generator. If you use the Footprint to determine direction, you'll end up in an endless loop: long, short, long, short, short, long. Every new candle tells a different story, and without a higher-level framework, you'll flip your opinion with every candle.
The correct approach: you have a direction from your market structure analysis. You need a confirmation and timing tool. That's the Footprint. If your analysis shows a long setup at a certain level and you see in the Footprint that aggressive sellers there can't push price down, you have your confirmation. The framework provides the direction, order flow confirms the timing.
What You Should NOT Do in Footprint
Three mistakes I see traders making repeatedly:
Analyzing every candle. The Footprint is not a live ticker you watch nonstop. You specifically look at relevant price levels when price reaches them. Everything else is noise.
Trading imbalances in isolation. A Stacked Imbalance without context is not a trade setup. Imbalances show momentum, but momentum without a directional thesis is a coin flip.
Ignoring market structure. No Footprint pattern in the world replaces clean analysis. What happens at macro levels, daily structure and trend context always comes first. The Footprint confirms or disproves your idea, it doesn't generate it. How macroeconomic data affects the daily bias plays a critical role in interpreting your Footprint on high volatility days.
You can only recognize advanced concepts like "transformation" (where the order flow pattern changes abruptly because institutional participants intervene) once you've internalized this framework. Without a framework, you see the numbers. With a framework, you understand the context. If you want to go deeper into detecting institutional footprints, read our guide on Big Trades and their significance.
Which Software for Footprint Charts?
The two relevant platforms for Footprint analysis in futures trading are ATAS and Bookmap. Both show the same data, just prepared differently. Footprint and Tick Chart work with the same data basis, just in different representations.
ATAS is the primary recommendation for Footprint work. The software covers Footprint Charts, Volume Profiles, Cluster Statistics, Imbalances and Big Trades in one platform. At United Daytraders, we use exclusively ATAS for our Footprint analysis and provide our members with pre-configured templates.
Bookmap excels in heatmap display and visualizing liquidity in the order book. Those who mainly work with heatmaps and liquidity flows will find the better solution in Bookmap. However, for pure Footprint analysis, ATAS offers more depth.
You can find a detailed comparison of the tools in our Order Flow Software Comparison article.
FAQ: Footprint Charts
Do I need Footprint Charts to trade?
No, Footprint Charts are not required. But institutional traders have always worked with order book and transaction data, exactly the data that the Footprint visually prepares. For retail traders who trade futures and want to understand the behavior of large market participants, Footprint Charts are the most accessible tool for this.
What timeframe do I read Footprint Charts on?
That depends on the product and your trading style. For the ES, many traders use 5-minute charts as an overview and switch to smaller timeframes for entry. The critical factor is not the timeframe, but that you read volume distribution in the context of market structure.
In our mentoring program, you'll learn these concepts in over 1,500 video lessons with real chart examples. The Footprint Deep Dive in the Bootcamp alone comprises 18 lessons that guide you step by step from reading individual clusters to detecting institutional patterns.