Identifying Market Phases: How to Read Trend, Range and Anomaly Conditions
Identifying market phases is the single most important decision you make before entering a trade. Every strategy works brilliantly in its native regime and fails miserably in the wrong one. Yet most traders skip this step entirely, jumping straight to entries and stops without asking the only question that matters: what type of day is this?
Risk Disclaimer: Trading futures and other financial instruments involves significant risk of loss. Past results are not indicative of future performance. Only trade with capital you can afford to lose.
In my experience coaching futures traders, the majority of blown accounts trace back to a single root cause: applying a trend strategy on a range day or fading a trend that never looked back. Identifying the current market phase is not some optional overlay. It is the foundation that every other decision rests on. In this article, I will walk you through the three-regime classification I use every trading day and show you how to read the clues the market offers in the first 30 minutes of the session.
The Three Market Phases
Markets do not behave randomly. They cycle through distinct behavioral regimes, each with its own internal logic. Understanding these three phases and their approximate frequency gives you a massive edge over traders who treat every day the same.
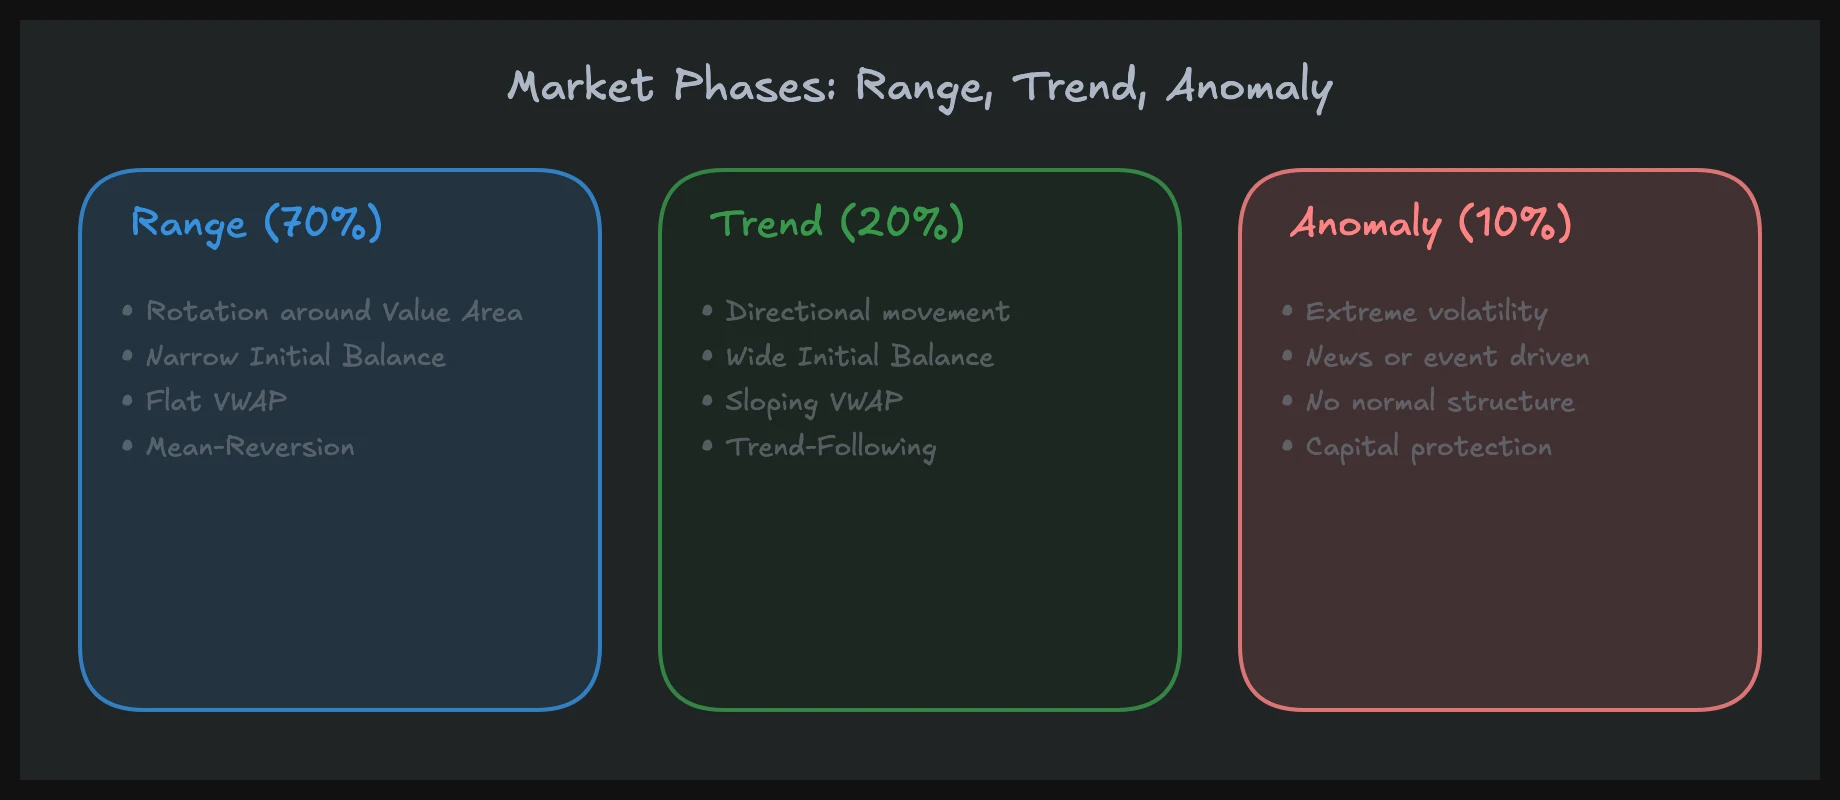
Range (~70% of Days)
The range phase is by far the most common market condition. On roughly 70% of trading days, the Nasdaq 100 futures (NQ) establish a value area early in the session and then rotate within that range for the remainder of the day. Buyers and sellers agree on a general price zone, and the auction moves back and forth inside those boundaries.
The volume profile on a range day produces a classic D-shaped distribution. Volume clusters heavily around the center, forming a thick point of control, with thin tails at both extremes. When you see that shape developing in real time, it tells you that the market is building value rather than searching for new price levels.
Range days reward mean-reversion strategies. Fading moves toward the edges of the developing range and targeting the value area center is the bread-and-butter approach. The trap for most traders is that range days can feel boring, and boredom leads to forcing trades that assume a breakout is coming when the structure says otherwise.
Trend (~20% of Days)
On about 20% of trading days, the market moves directionally with conviction. Trend days in NQ can produce moves of 200 to 400 points from the opening price, and they tend to close near the extreme of the range. Once a trend day establishes itself, pullbacks are shallow and brief.
The volume profile on a trend day looks fundamentally different from a range day. Instead of the symmetrical D-shape, you see a P-shaped profile on an up-trend day (heavy volume at the top, thin volume at the bottom) or a b-shaped profile on a down-trend day (heavy volume at the bottom, thin at the top). These skewed distributions tell you that the auction is one-directional. For a deeper look at this distinction, see my article on one-way vs. two-way markets.
Trend days reward continuation strategies: buying pullbacks in an uptrend, selling rallies in a downtrend. The cardinal sin on a trend day is fading the move too early, expecting a reversal that never comes. I have seen traders take four or five counter-trend entries in a row, each one stopped out, because they refused to accept the regime.
Anomaly (~10% of Days)
Anomaly days are the rarest and the most dangerous. These are sessions driven by unexpected catalysts: surprise Fed announcements, geopolitical shocks, major earnings misses in index heavyweights, or liquidity vacuums around holidays. The market moves violently, often gapping through key levels and ignoring normal support and resistance.
On an anomaly day, standard strategies break down. The volume profile looks fragmented, with multiple thin clusters and no coherent value area. Spreads widen, order flow becomes erratic, and normal correlations can temporarily decouple. In my experience, the best response to a confirmed anomaly day is to reduce size dramatically or step aside entirely. Protecting capital on these 10% of sessions is what allows you to compound gains on the other 90%.
Identifying Market Phases Early: The First 30 Minutes
The opening 30 minutes of the regular session contain the most diagnostic information of the entire trading day. Learning to read these early signals accurately is a skill that separates consistently profitable traders from everyone else.
Initial Balance and VWAP as Early Indicators
The initial balance (IB), the range established during the first 30 to 60 minutes, sets the framework for the rest of the session. A narrow IB relative to the average suggests that the market is coiling, and a directional move may follow. A wide IB often indicates that the day's range has already been largely established and the market may rotate within it.
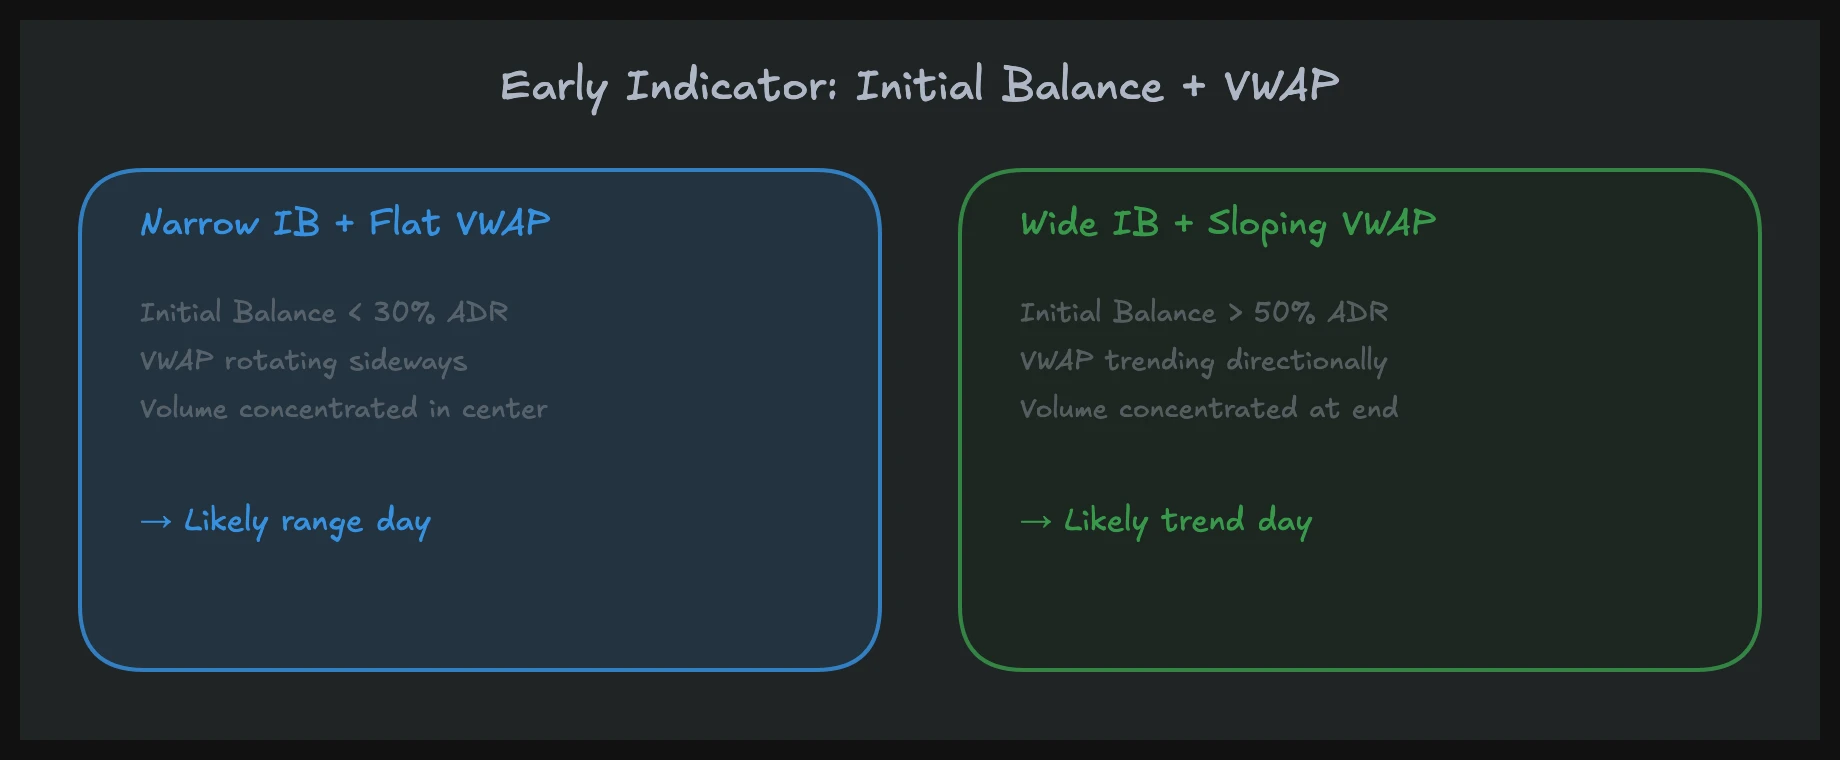
VWAP (volume-weighted average price) provides the second critical data point. On a range day, price tends to oscillate around VWAP, crossing it multiple times. On a trend day, price moves away from VWAP decisively in one direction and stays on one side for most of the session. If you see NQ open, push 50 points above VWAP within the first 20 minutes, and hold there without retesting, that is a strong early signal of a trend day.
The combination of IB width and VWAP behavior gives you a probabilistic read on the developing regime well before the session is half over.
Reading the Developing Volume Profile
As the session progresses, the shape of the volume profile evolves in real time. Watching this development is one of the most reliable ways to confirm your initial phase classification.
If volume starts clustering symmetrically around the midpoint of the range, the D-shape is forming and a range day is likely. If volume builds predominantly on one side, the skewed P or b shape is emerging and the market is signaling trend behavior. Fragmented, multi-modal distributions with no clear center suggest anomaly conditions.
I check the developing profile at three fixed intervals: after the IB close, at the midday checkpoint, and heading into the final 90 minutes. Each checkpoint either confirms or challenges the initial read. Being willing to update your classification mid-session is critical. Rigidly clinging to an early read that the data no longer supports is just as costly as having no read at all.
Why the Wrong Phase Destroys Any Strategy
This is the point I hammer home constantly: no strategy is inherently good or bad. Every strategy is phase-dependent. A mean-reversion approach that generates steady profits on range days will produce catastrophic losses on a trend day. A trend-following system that captures big moves 20% of the time will slowly bleed out on the 70% of days that are range-bound.
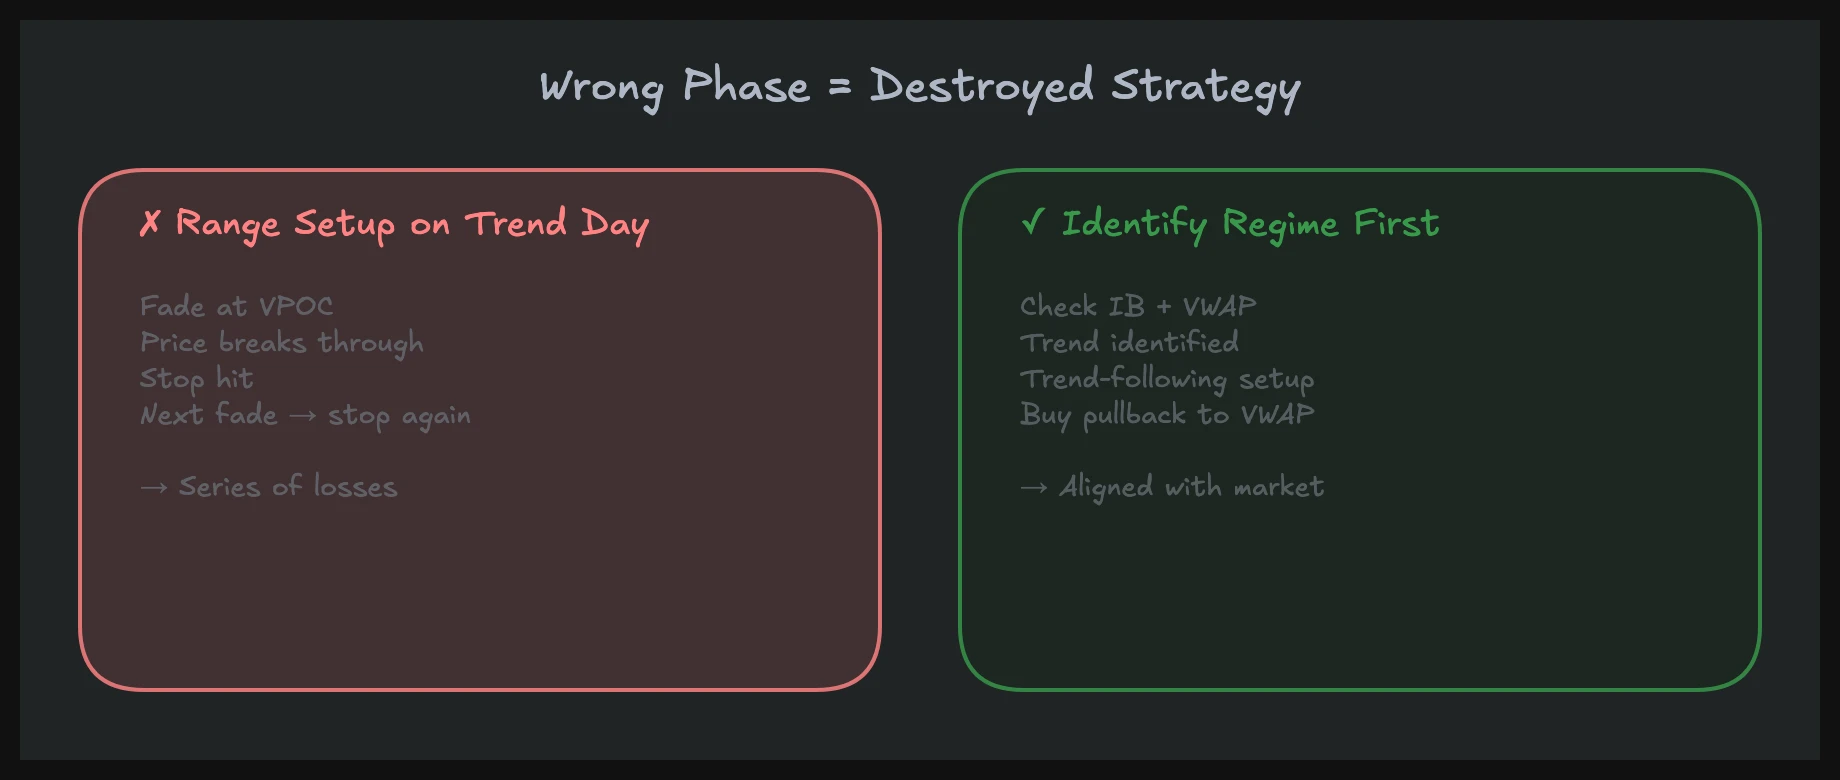
The math is straightforward. If you apply a range strategy on a trend day, you are fading a move that does not mean-revert. Your stops get hit repeatedly as the market extends. One or two trend days with the wrong strategy can erase weeks of range-day profits. This asymmetry is why regime identification must come before strategy selection, not after.
In my coaching, I frame it this way: before you ask "where do I enter," ask "what type of day is this." The entry is a tactical decision. The phase classification is strategic. Get the strategy wrong and no tactic saves you.
The broader framework of auction market theory provides the conceptual foundation for understanding why markets cycle through these phases. And for traders focused specifically on NQ, my guide to Nasdaq futures trading covers how these regime dynamics play out in the contract's unique liquidity and volatility profile.
FAQ: Market Phases
How do I determine the current market phase?
Start with the initial balance width relative to the 20-day average, then observe VWAP interaction and the developing volume profile shape. A narrow IB with price holding one side of VWAP suggests a trend day. A wide IB with VWAP crosses suggests a range day. Unusual overnight gaps combined with elevated volatility and fragmented profiles point toward an anomaly day. Confirm your initial read at regular checkpoints throughout the session.
Which strategy fits which market phase?
Range days favor mean-reversion: fading moves at the edges and targeting the value area center. Trend days favor continuation: entering on pullbacks in the direction of the dominant move. Anomaly days call for capital preservation: reduced size, wider stops, or no trading at all. The key insight is that you choose the strategy after you classify the phase, never the other way around.
Can market phases change during the day?
Yes, and recognizing the shift is a critical skill. A range day can transition into a trend day if a news catalyst hits mid-session or if the market breaks out of the established value area on strong volume. Similarly, what begins as a trend day can stall and rotate back into a range. I review the volume profile at fixed intervals to catch these transitions early. The willingness to update your classification based on new evidence separates adaptable traders from rigid ones.
In our mentoring program, you'll learn these concepts in over 1,500 video lessons with real chart examples.