Auction Market Theory: The Foundation of Professional Market Analysis
Auction Market Theory (AMT) is the idea that every market is an auction where buyers and sellers negotiate price until they reach temporary equilibrium. Price moves away from this fair value to discover new information, then returns to establish a new balance. This single framework explains why tools like volume profile and VWAP actually work.
Risk Disclaimer: Trading futures and other financial instruments involves significant risk of loss. Past results are not indicative of future performance. Only trade with capital you can afford to lose.
Most traders learn indicators first. Moving averages, RSI, MACD. They stack three or four of them on a chart and wait for signals to align. I did the same thing when I started trading NQ futures back in 2017. The problem was simple: none of those indicators told me why price was moving. They described what had already happened and offered educated guesses about what might come next.
Auction Market Theory changed everything for me. It gave me a mental model for understanding markets that made every other tool click into place. Volume profile stopped being a histogram on my chart and became a map of where buyers and sellers had agreed on value. VWAP stopped being a line and became the session's running fair price. Once you understand AMT, you stop looking for patterns and start reading what the market is actually telling you.
In this article, I'll walk through the core concepts of Auction Market Theory, show you how they apply to real day trading in NQ and ES futures, and explain why this framework separates professional traders from everyone else.
Every Market Is an Auction
The Auction Metaphor
Think about an eBay auction. A seller lists an item at a starting price. If the price is too high, nobody bids. The seller lowers the price until a buyer shows interest. Once bids start coming in, the price rises until only one buyer remains. The final price represents the point where supply (one item) met demand (one willing buyer at that specific price).
Futures markets work the same way, just faster and with more participants. Every tick on an NQ chart represents a completed auction. A buyer said "I'll pay this price" and a seller said "I'll sell at this price." When lots of transactions happen at a specific price level, that tells you something important: participants agree that this is a reasonable price. When very few transactions happen at a level, it means price moved through quickly because one side saw it as too cheap or too expensive.
This is not a metaphor. This is literally what happens in the order book every single day. The CME's matching engine runs continuous auctions, pairing buy orders with sell orders millions of times per session.
Price as Information Mechanism
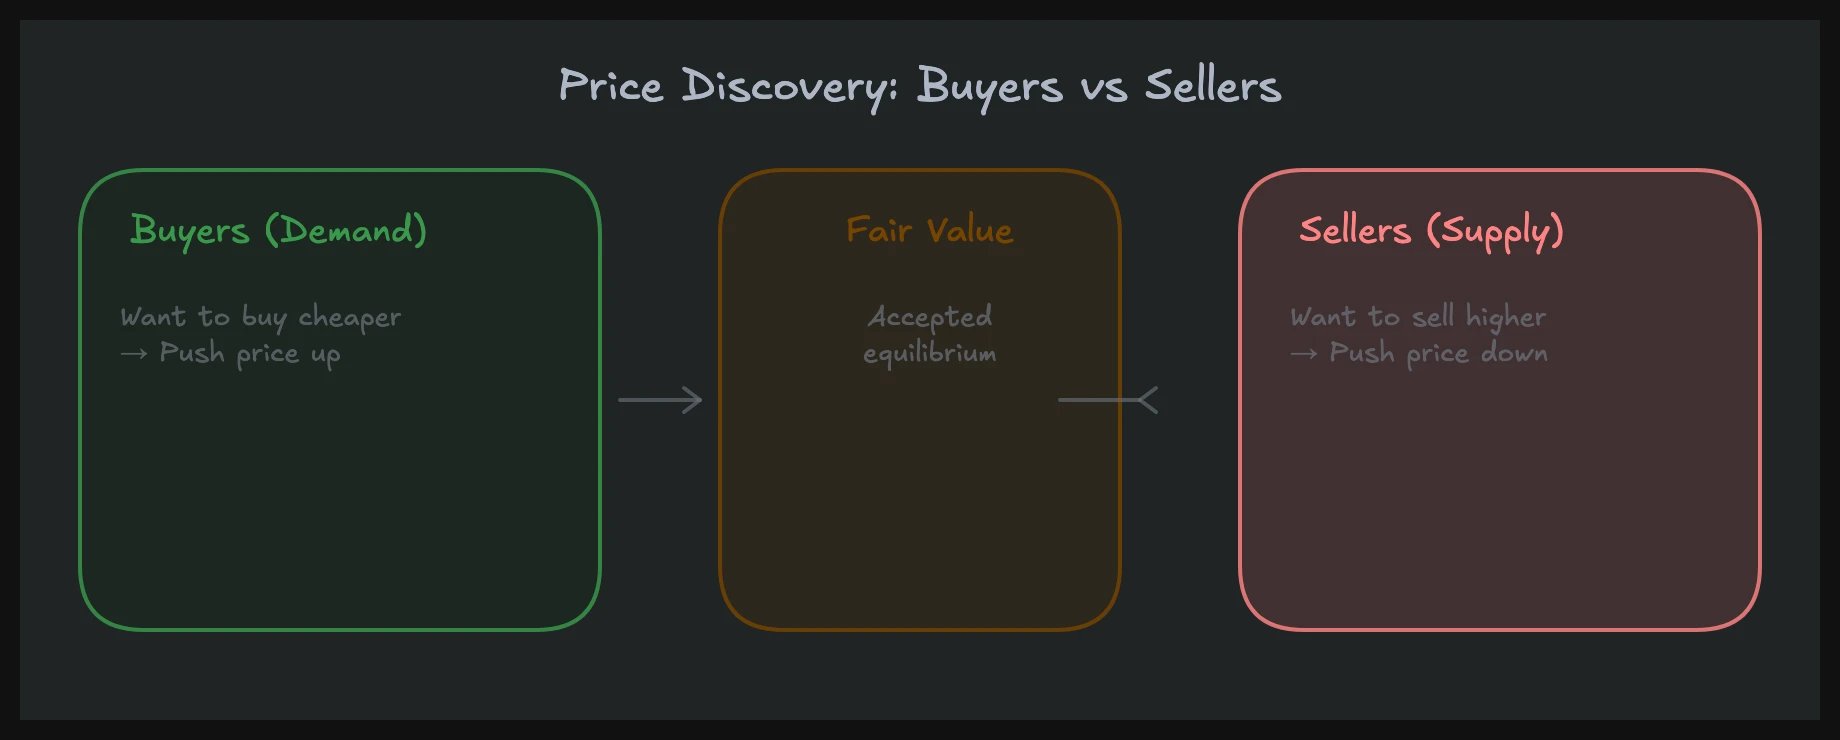
Here is the concept that changed how I read charts: price is not trying to go up or down. Price is an information-gathering mechanism. Its job is to find the level where the most trade can happen between buyers and sellers.
When NQ sits at 18,500 and nobody wants to sell, price has to move higher to attract sellers. It keeps rising until sellers show up. Maybe at 18,550, some sellers step in, but not enough. Price pushes to 18,600, and now aggressive selling meets the buying. Transactions pile up. The auction has found a temporary fair price.
This is price discovery. It happens on every timeframe, from the one-minute chart to the monthly. The market is always asking: "Is this price too high? Too low? Or just right?" Volume tells you the answer. High volume at a price means acceptance. Low volume means rejection.
Once you see markets this way, random-looking price action starts making sense. That "choppy" price action in the first 30 minutes of RTH? That's the auction discovering the session's initial value area. That sharp move at 10:15 AM that reversed immediately? Price probed higher, found no willing buyers at elevated prices, and returned to accepted value.
The Three Market States
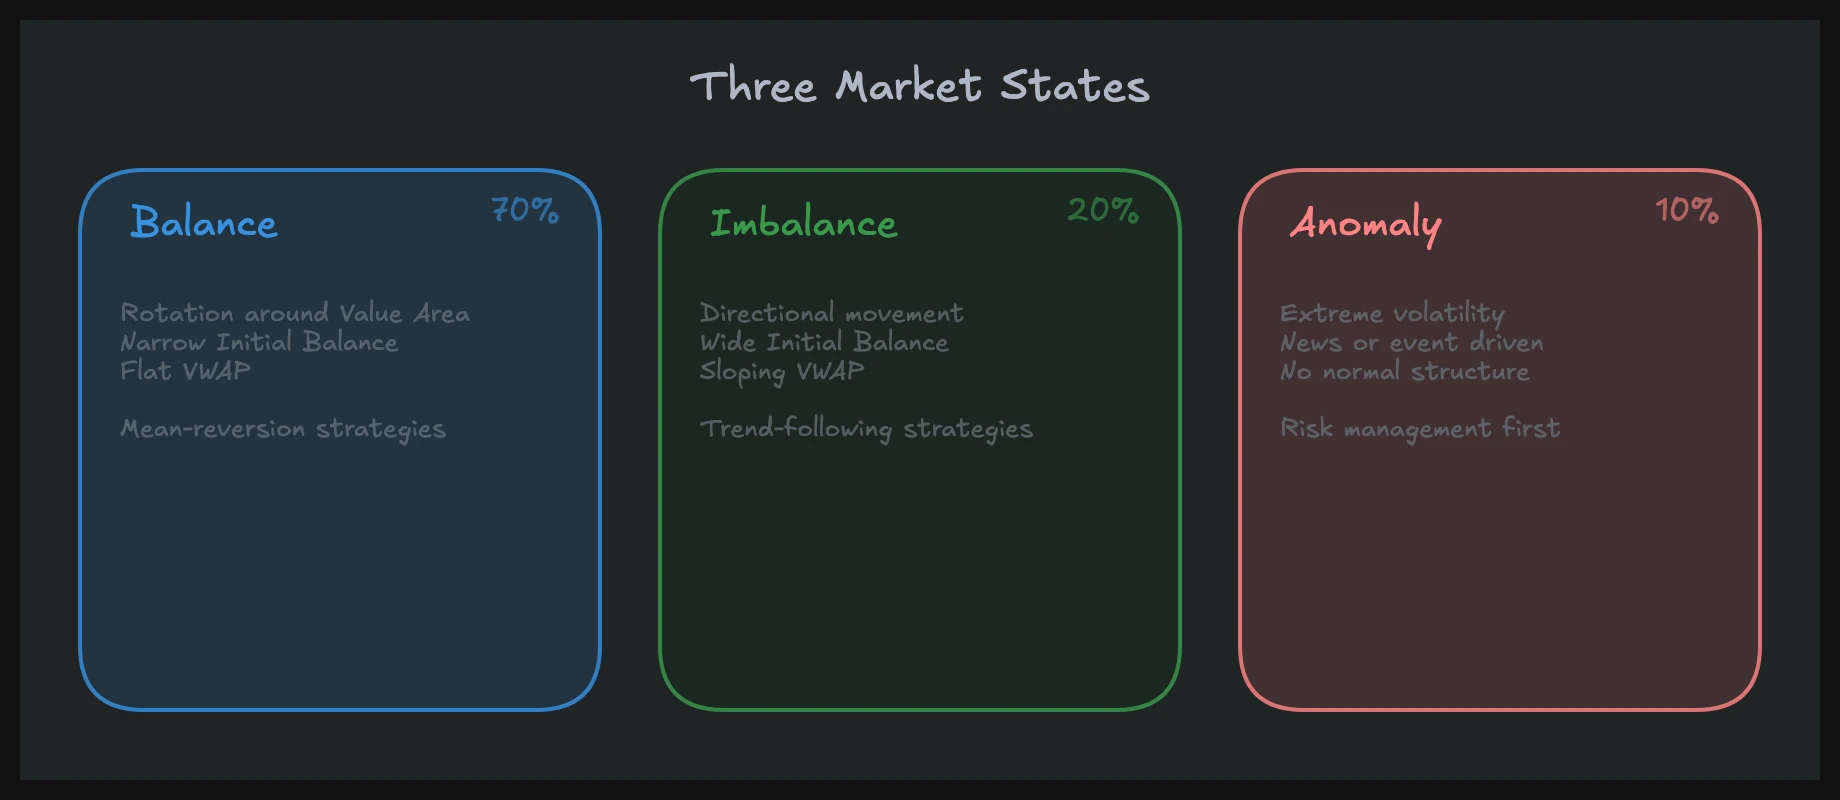
Every market, on every timeframe, exists in one of three states. Recognizing which state you're in is the single most important skill in day trading. It determines everything: your strategy, your targets, your risk management, and whether you should even be trading at all.
Balance (Range)
Balance means the market has found a price range where buyers and sellers are roughly equal in conviction. Neither side has enough force to push price meaningfully in one direction. You see this as price rotating between the upper and lower boundaries of a value area.
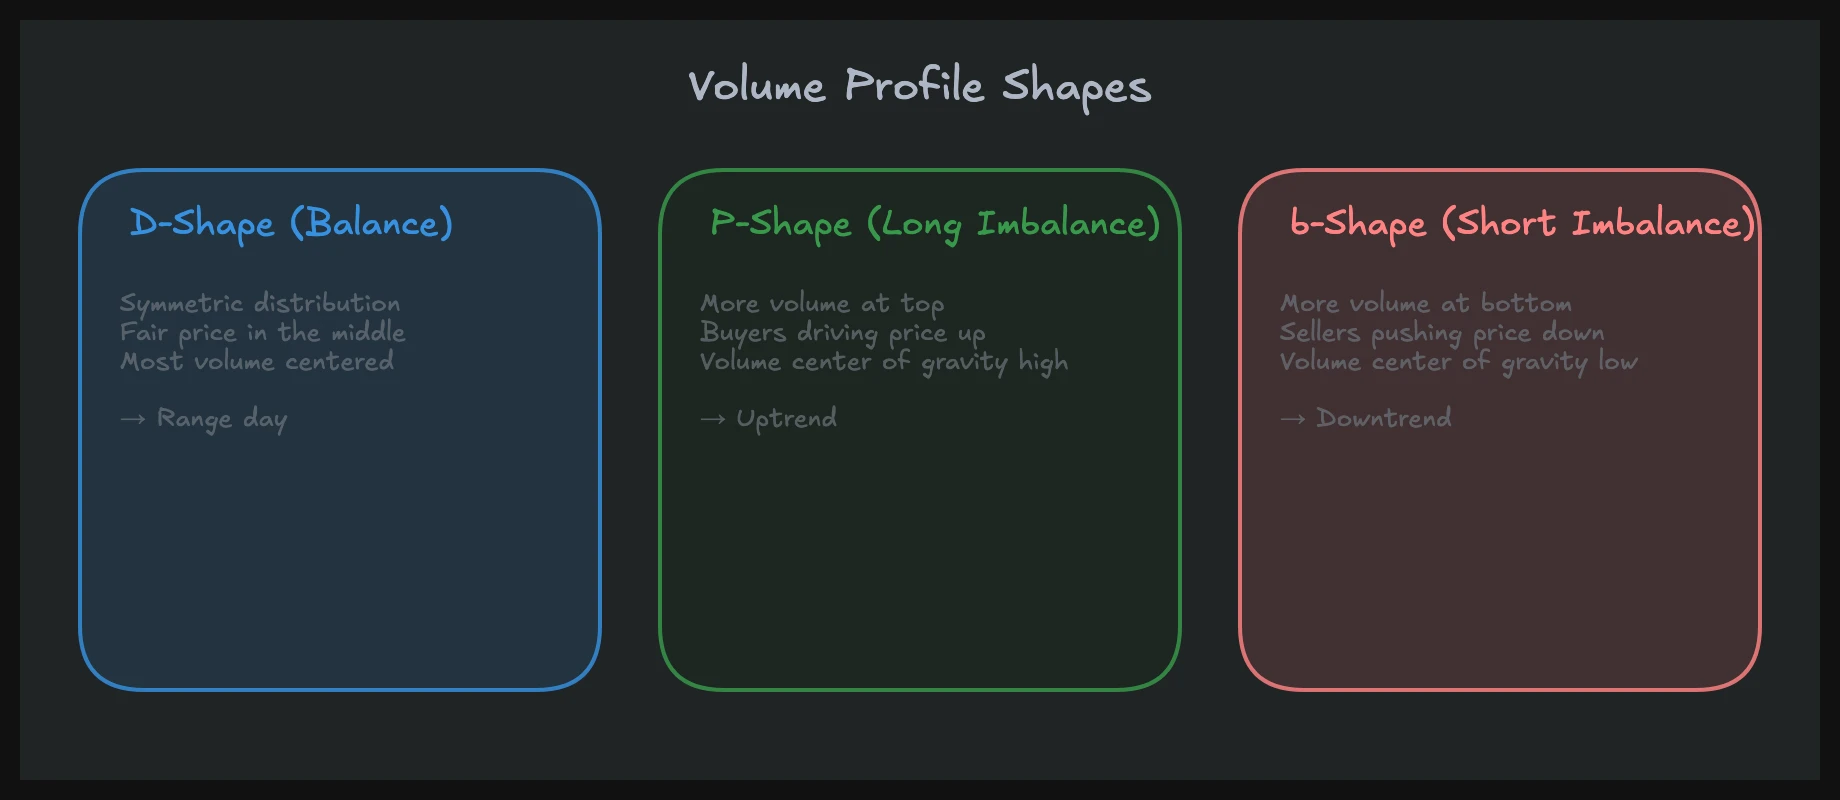
On a volume profile, balance produces a D-shaped distribution. The point of control sits in the middle, with volume tapering off symmetrically toward the highs and lows. The VWAP line is relatively flat, hovering near the middle of the range.
Balance days in NQ often look like this: the market opens, establishes an initial balance range (say 18,480 to 18,520), and then spends the rest of the session rotating within that 40-point range. Price touches the top, sells off. Touches the bottom, bounces. The value area high and low act like magnets, pulling price back each time it tries to escape.
About 60-70% of trading days show some form of balance behavior. Knowing this saves you from forcing directional trades when the market has no intention of trending.
Imbalance (Trend)
Imbalance means one side has overwhelmed the other. Buyers are so aggressive that sellers can't hold any level, or sellers are so aggressive that buyers get steamrolled. Price moves directionally with purpose.
On a volume profile, imbalance produces a P-shaped distribution (buying imbalance, value area in the upper portion) or a b-shaped distribution (selling imbalance, value area in the lower portion). The VWAP slopes noticeably in the direction of the trend. Each new 30-minute period builds value higher (or lower) than the last.
Imbalance days in NQ are unmistakable once you know what to look for. The market opens and immediately pushes in one direction. It might pull back 10 or 15 points, but it never seriously threatens the prior swing low (in an uptrend). By noon, the profile looks nothing like a bell curve. It's skewed heavily to one side.
These are the days where trying to pick tops or bottoms destroys accounts. I've watched traders fade an NQ trend day and take five consecutive losing trades, each one "certain" that the move was overextended. The market doesn't care about your opinion. In imbalance, price is discovering new value, and fighting that process is expensive.
Transition
The transition between balance and imbalance is where the money is. This is the moment when a balanced market begins to break out, or when a trending market exhausts itself and starts building a new range.
Transitions don't happen instantly. There are usually warning signs. In a balanced market about to trend, you'll see price repeatedly testing one boundary of the value area. Each test might hold, but the reactions get weaker. Volume at the boundary thins out. Then one test breaks through, volume expands on the breakout side, and the old range becomes irrelevant.
Going the other direction, a trending market transitioning to balance often shows up as an elongated value area that starts to fill in. The trend slows. Pullbacks get deeper. Eventually, price fails to make a new extreme and starts rotating. A new balance area forms around the last trend's high (or low).
Catching these transitions is the highest-edge activity in day trading. It requires patience. You have to let the market show you what it's doing before committing capital. But when you identify a transition correctly, the risk/reward is excellent because you're entering at the beginning of a new regime, not the end of an old one.
AMT in Practice: Volume Profile, VWAP and Initial Balance
Volume Profile as AMT Visualization
Volume profile is AMT made visible. Instead of showing volume over time (like a traditional volume histogram), it shows volume at price. This immediately tells you where the auction found agreement and where it didn't.
The key levels from a volume profile map directly to AMT concepts:
- Point of Control (POC): The price with the most volume. This is the auction's fair price for that period. It's where the most trade facilitation happened.
- Value Area (VA): The range containing roughly 70% of the volume. This is where participants agreed on value. Think of it as the "fair price zone."
- Value Area High / Low: The boundaries of agreed-upon value. These are the edges of the auction. Beyond them, one side considered prices too extreme.
- Low Volume Nodes: Prices where the auction spent little time. Price moved through these levels quickly because one side saw opportunity. These become support and resistance, not because of lines on a chart, but because the market already told you it doesn't accept these prices as fair.
When I look at yesterday's volume profile on NQ, I'm reading an auction record. If today's opening price is inside yesterday's value area, the market is saying: "Yesterday's fair price is still relevant." If we open outside yesterday's value area, the market is saying: "Something changed overnight. We need to discover new value."
VWAP as Dynamic Fair Value
VWAP (Volume Weighted Average Price) is the session's running fair price. It accounts for both price and volume, giving you a real-time read on where the average transaction has occurred.
In AMT terms, VWAP is the auction's ongoing consensus. When price trades above VWAP, buyers are paying more than the average participant paid. When price trades below VWAP, sellers are accepting less than the average transaction. Neither situation is sustainable for long in a balanced market, which is why price tends to revert to VWAP during range days.
On trend days, VWAP slopes in the direction of the move and price stays on one side of it for most of the session. This is the auction building new value. The fair price is moving, and VWAP tracks it in real time.
I watch the slope and position of VWAP constantly. A flat VWAP with price crossing back and forth screams balance. A sloping VWAP with price respecting it as support (or resistance) screams imbalance. This one observation filters out half the bad trades most people take.
Initial Balance and Session Expectations
The initial balance (IB) is the price range established during the first hour of regular trading hours (9:30-10:30 AM ET for US equity futures). It's the opening auction's result.
The IB sets expectations for the rest of the session. A wide IB (say, 50+ points in NQ) suggests that the early auction was aggressive and volatile. Often, a wide IB contains the day's range, leading to a balanced day where price rotates within or near the IB boundaries.
A narrow IB (under 25 points in NQ) suggests low early conviction. This often precedes a breakout. One side eventually takes control, and price extends well beyond the initial balance. These can become strong trend days.
The IB extension tells you who took control. If price breaks above the IB high and holds, buyers won the opening auction and are pushing for higher value. If price breaks below the IB low, sellers have the upper hand. Watching which side of the IB extends first, and whether that extension holds, gives you an early read on the day's character.
AMT for NQ Day Trading
Trading Balance Days
Balance days reward patience and mean-reversion strategies. The playbook is straightforward: identify the value area boundaries and trade from the extremes toward the middle.
When NQ is rotating in a 40-point range with a flat VWAP, I'm looking to sell near the top of the range and buy near the bottom. Not blindly, but with confirmation. I want to see price reach the VA high, show signs of rejection (maybe a one-way move into resistance followed by a rotation), and then enter short targeting VWAP or the POC.
The key mistake on balance days is having targets that are too ambitious. If the range is 40 points, don't expect 35-point winners. Take your 15-20 points on each rotation and be satisfied. Balance days are about accumulation through frequency, not home-run trades.
Another common error: continuing to fade the range after it breaks. If NQ has been rotating between 18,480 and 18,520 for three hours and then pushes through 18,520 with expanding volume, don't short it expecting another rotation. The balance may be transitioning to imbalance. Respect the information.
Trading Imbalance Days
Imbalance days reward a completely different approach. The playbook here is: identify the direction early and only trade with it. Do not fade the trend.
On a trend day in NQ, I'm looking for pullbacks to VWAP or to the developing value area as entry opportunities. Price might run 100 points from the open, pull back 20 points to VWAP, and then resume the trend for another 60 points. That pullback to VWAP is the auction offering a "fair price" within the trending context.
The hardest part of trading imbalance days is psychological. After watching NQ run 80 points without you, every fiber of your being screams "it's overextended, short it." This is a losing mindset. On genuine imbalance days, the move that looks overextended at 10 AM often doubles by 2 PM.
How do you know it's an imbalance day? Check the developing volume profile shape. If it's P-shaped or b-shaped by mid-morning, you're likely in a trend. Check VWAP. If it's sloping clearly and price hasn't crossed it since the early session, you're in a trend. Check the order flow. If aggressive market orders consistently favor one side, you're in a trend.
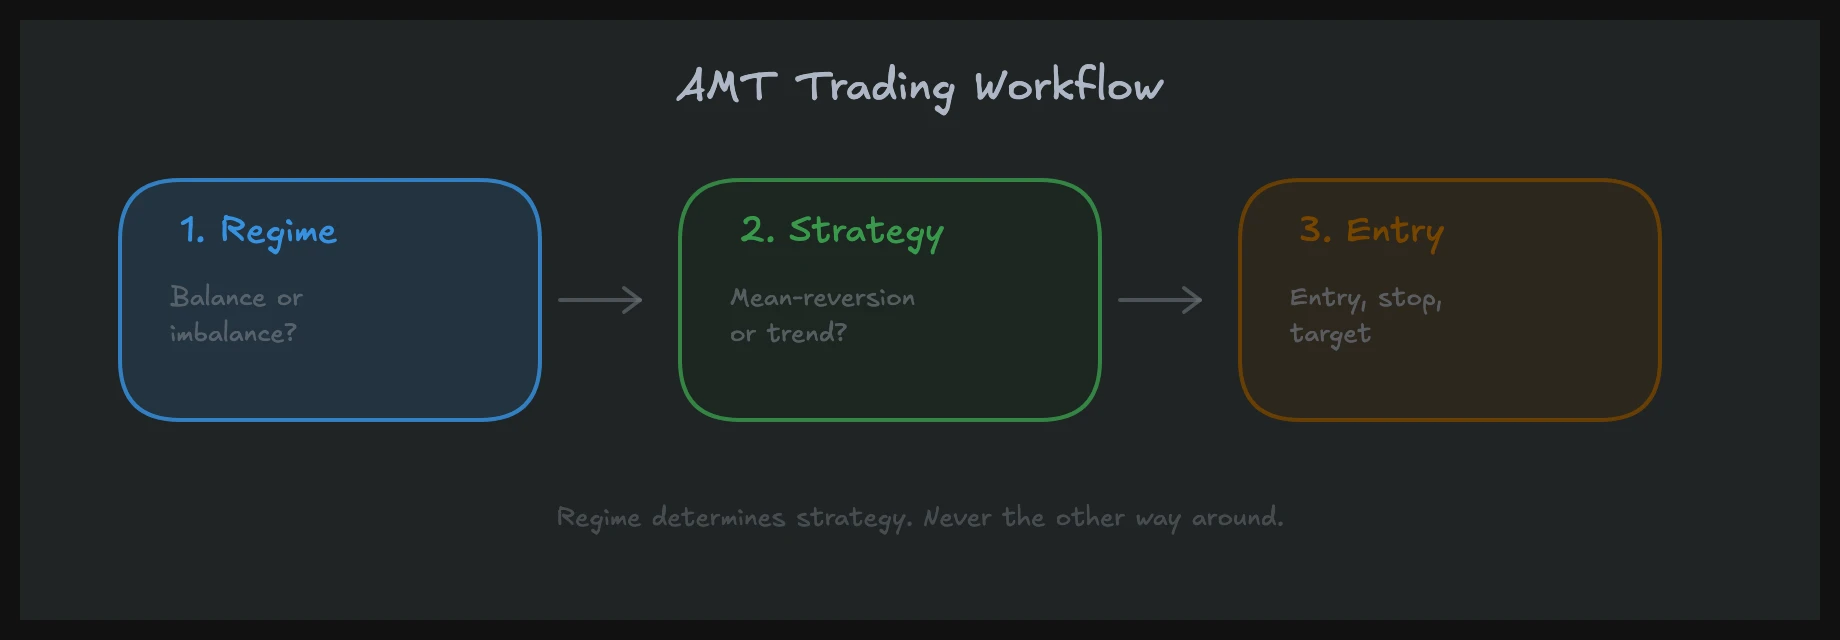
Regime Identification Comes First
Before I take any trade, I answer one question: what regime is the market in right now? Balance, imbalance, or transition?
This is not optional. It's the first step. If I can't identify the regime, I don't trade. There's no setup, no indicator signal, no pattern that overrides regime identification. A perfect-looking short setup in a strong uptrend will lose money. A mean-reversion trade in a trending market will lose money. Getting the regime right is 80% of the work.
I spend the first 30-45 minutes of RTH just watching. Where did we open relative to yesterday's value? How is the initial balance developing? What's the overnight inventory? Is VWAP flat or sloping? Are we inside or outside of the multi-day value area?
By 10:15 or 10:30 AM, I usually have a working hypothesis. Balance day? Imbalance? Potential transition? That hypothesis shapes every decision for the rest of the session. If new information contradicts it, I update. But I always have a thesis before I place a trade.
AMT vs. Technical Analysis
Shape vs. Acceptance
Traditional technical analysis focuses on shape recognition. Head and shoulders. Double tops. Triangles. Flags. These patterns describe what price looks like on a chart. AMT asks a fundamentally different question: where did the market accept value?
A "double top" in TA terms is just a pattern. In AMT terms, it's the auction testing a price level twice and failing to find acceptance above it. The AMT interpretation is more useful because it tells you why the pattern matters and gives you a volume-based way to confirm or reject it.
Consider a rising wedge on NQ. A traditional analyst sees the pattern and goes short. An AMT practitioner looks at the volume profile within that wedge. Is volume building at the highs (acceptance of higher prices) or at the lows (acceptance of lower prices)? If volume clusters at the top of the wedge, the "rising wedge bearish" setup might actually break upward because the market is accepting those higher prices.
This is why I stopped trading patterns in isolation. Shapes without volume context are incomplete information. AMT gives you the full picture.
Evaluating Breakouts Correctly
One of the most practical applications of AMT is evaluating breakouts. Traditional TA says: "price broke the level, buy/sell." AMT says: "did the market accept value beyond that level?"
The difference matters enormously. Many breakouts are just price probes. The auction pushes beyond a boundary to check if there's interest. If no volume follows, the probe fails and price returns to the prior value area. These are low-volume breakouts, and they trap traders constantly.
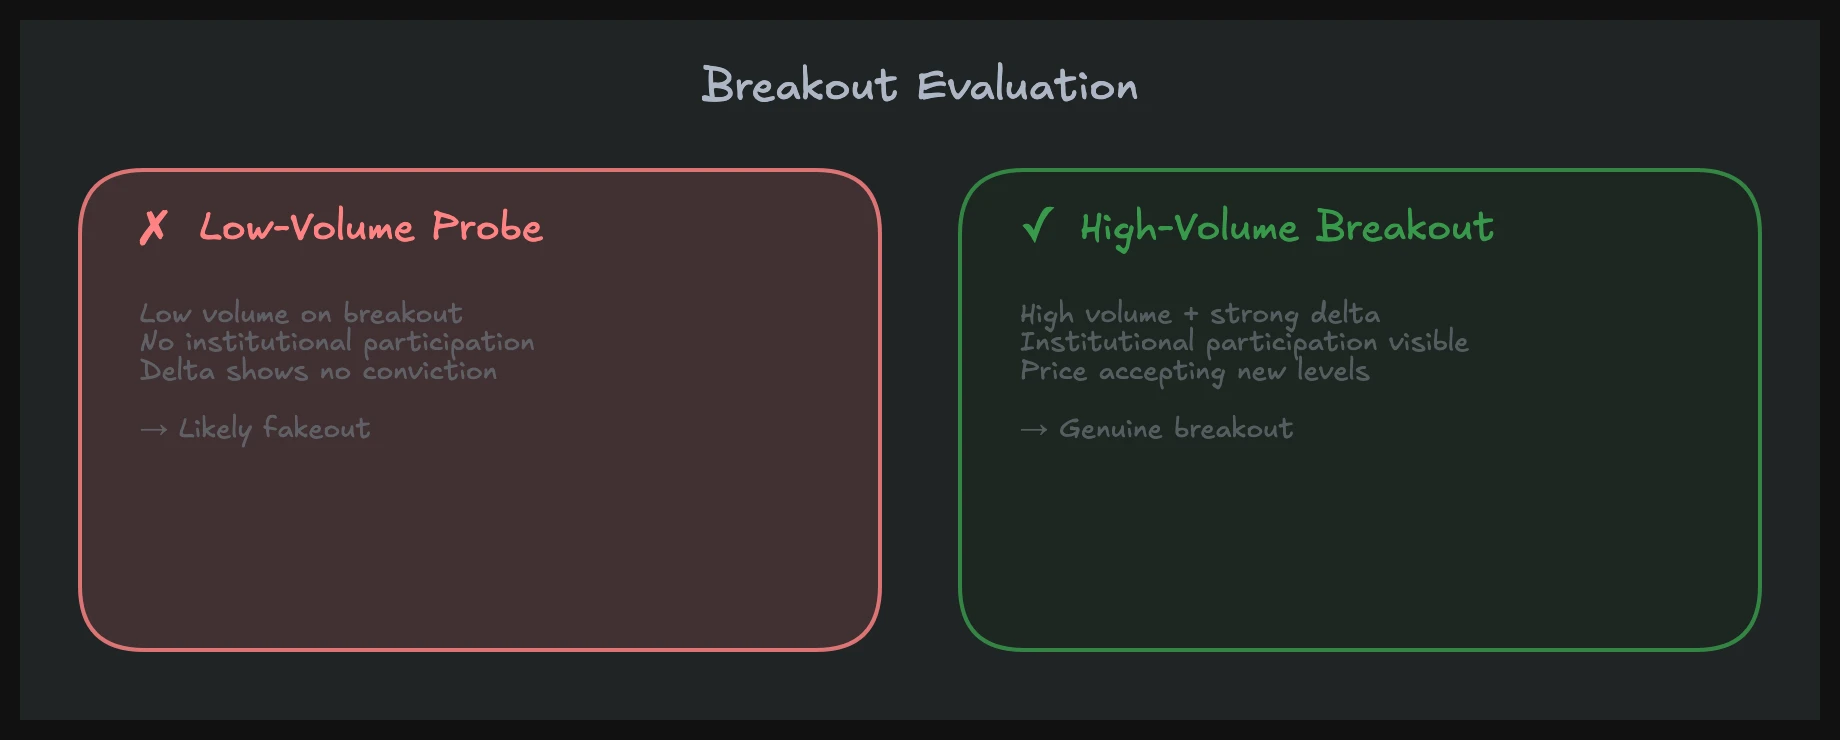
A genuine breakout has volume. Price moves beyond the prior value area and transactions pile up at the new prices. The profile starts building volume above the old VA high (or below the old VA low). VWAP migrates toward the new levels. This is the market telling you: "We've discovered new value. The old range is done."
When I watch NQ futures break above a multi-day value area high, I'm watching volume, not just price. Did the breakout bar have strong volume? Are subsequent bars holding above the level? Is the profile starting to fill in above the old boundary? If yes, the breakout is real. If volume is thin and price immediately stalls, it's a probe that will likely fail.
This single distinction between probes and genuine breakouts has saved me from countless losing trades.
FAQ: Auction Market Theory
What is Auction Market Theory?
Auction Market Theory is a framework that views all financial markets as two-sided auctions where buyers and sellers negotiate price. The core idea is that price moves to facilitate trade between participants. When price is at a level where buyers and sellers agree on value, the market is in balance and volume accumulates. When one side overwhelms the other, price moves directionally (imbalance) to discover new value. AMT provides the conceptual foundation for tools like volume profile, market profile, and VWAP, explaining why these tools work and how to interpret them in context.
How do I identify trend vs. range using AMT?
Look at three things: the volume profile shape, VWAP slope, and value area migration. A balanced (range) market produces a D-shaped, symmetrical volume profile with a flat VWAP. Price rotates around the point of control. A trending (imbalance) market produces a P-shaped (uptrend) or b-shaped (downtrend) profile with a sloping VWAP. The value area migrates in the trend direction across successive time periods. If you check these three indicators at the same time, they almost always agree on the market state. Disagreement between them can signal a transition is underway.
How do I know the fair price of a market?
In AMT, fair price is defined by volume, not by any formula or indicator. The point of control on a volume profile is the single price where the most trading occurred in a given period, making it the market's consensus fair price. The value area (approximately 70% of volume) defines the range of prices considered fair. VWAP offers a dynamic, real-time version of fair price that updates with each new transaction. For practical day trading, I use the developing session's POC and VWAP together. When they converge at the same level, that's the market's strongest statement about where fair value sits right now.
Understanding Auction Market Theory is what separates traders who read the market from traders who guess at it. Every tool you use after learning AMT becomes sharper because you understand the logic behind it.
In our mentoring program, you'll learn these concepts in over 1,500 video lessons with real chart examples. From reading the daily auction to identifying transitions in real time, the program covers everything you need to apply AMT in live NQ and ES trading.