Interest Rates and Bonds for Traders: The Key to Understanding Markets
Most futures and stock traders ignore bonds. They analyze price, order flow, volume, but overlook the largest market in the world that drives everything else. Bonds set the risk-free rate against which every asset is valued. When yields move, stocks and futures react. Those who understand interest rates and bonds trade with context. Those who ignore them trade blind. In my time as an institutional trader, the bond screen was the first thing I opened in the morning. This article deepens the bonds chapter from our Macroeconomics Guide for Traders and shows you how to concretely integrate interest rates and bonds into your daily trading routine.
Risk Disclaimer: Trading futures and other financial instruments carries substantial risk of loss. Past results are not indicative of future performance. Only invest capital you can afford to lose.
— Marco Bösing, Founder of United Daytraders
Why the Bond Market Matters for Day Traders
The bond market is the largest financial market in the world. Not stocks, not forex, not crypto. Bonds. The global market capitalization of bonds exceeds that of all stock markets combined. Yet most retail traders never look at bonds. That is like ignoring the ocean and wondering where the waves come from.
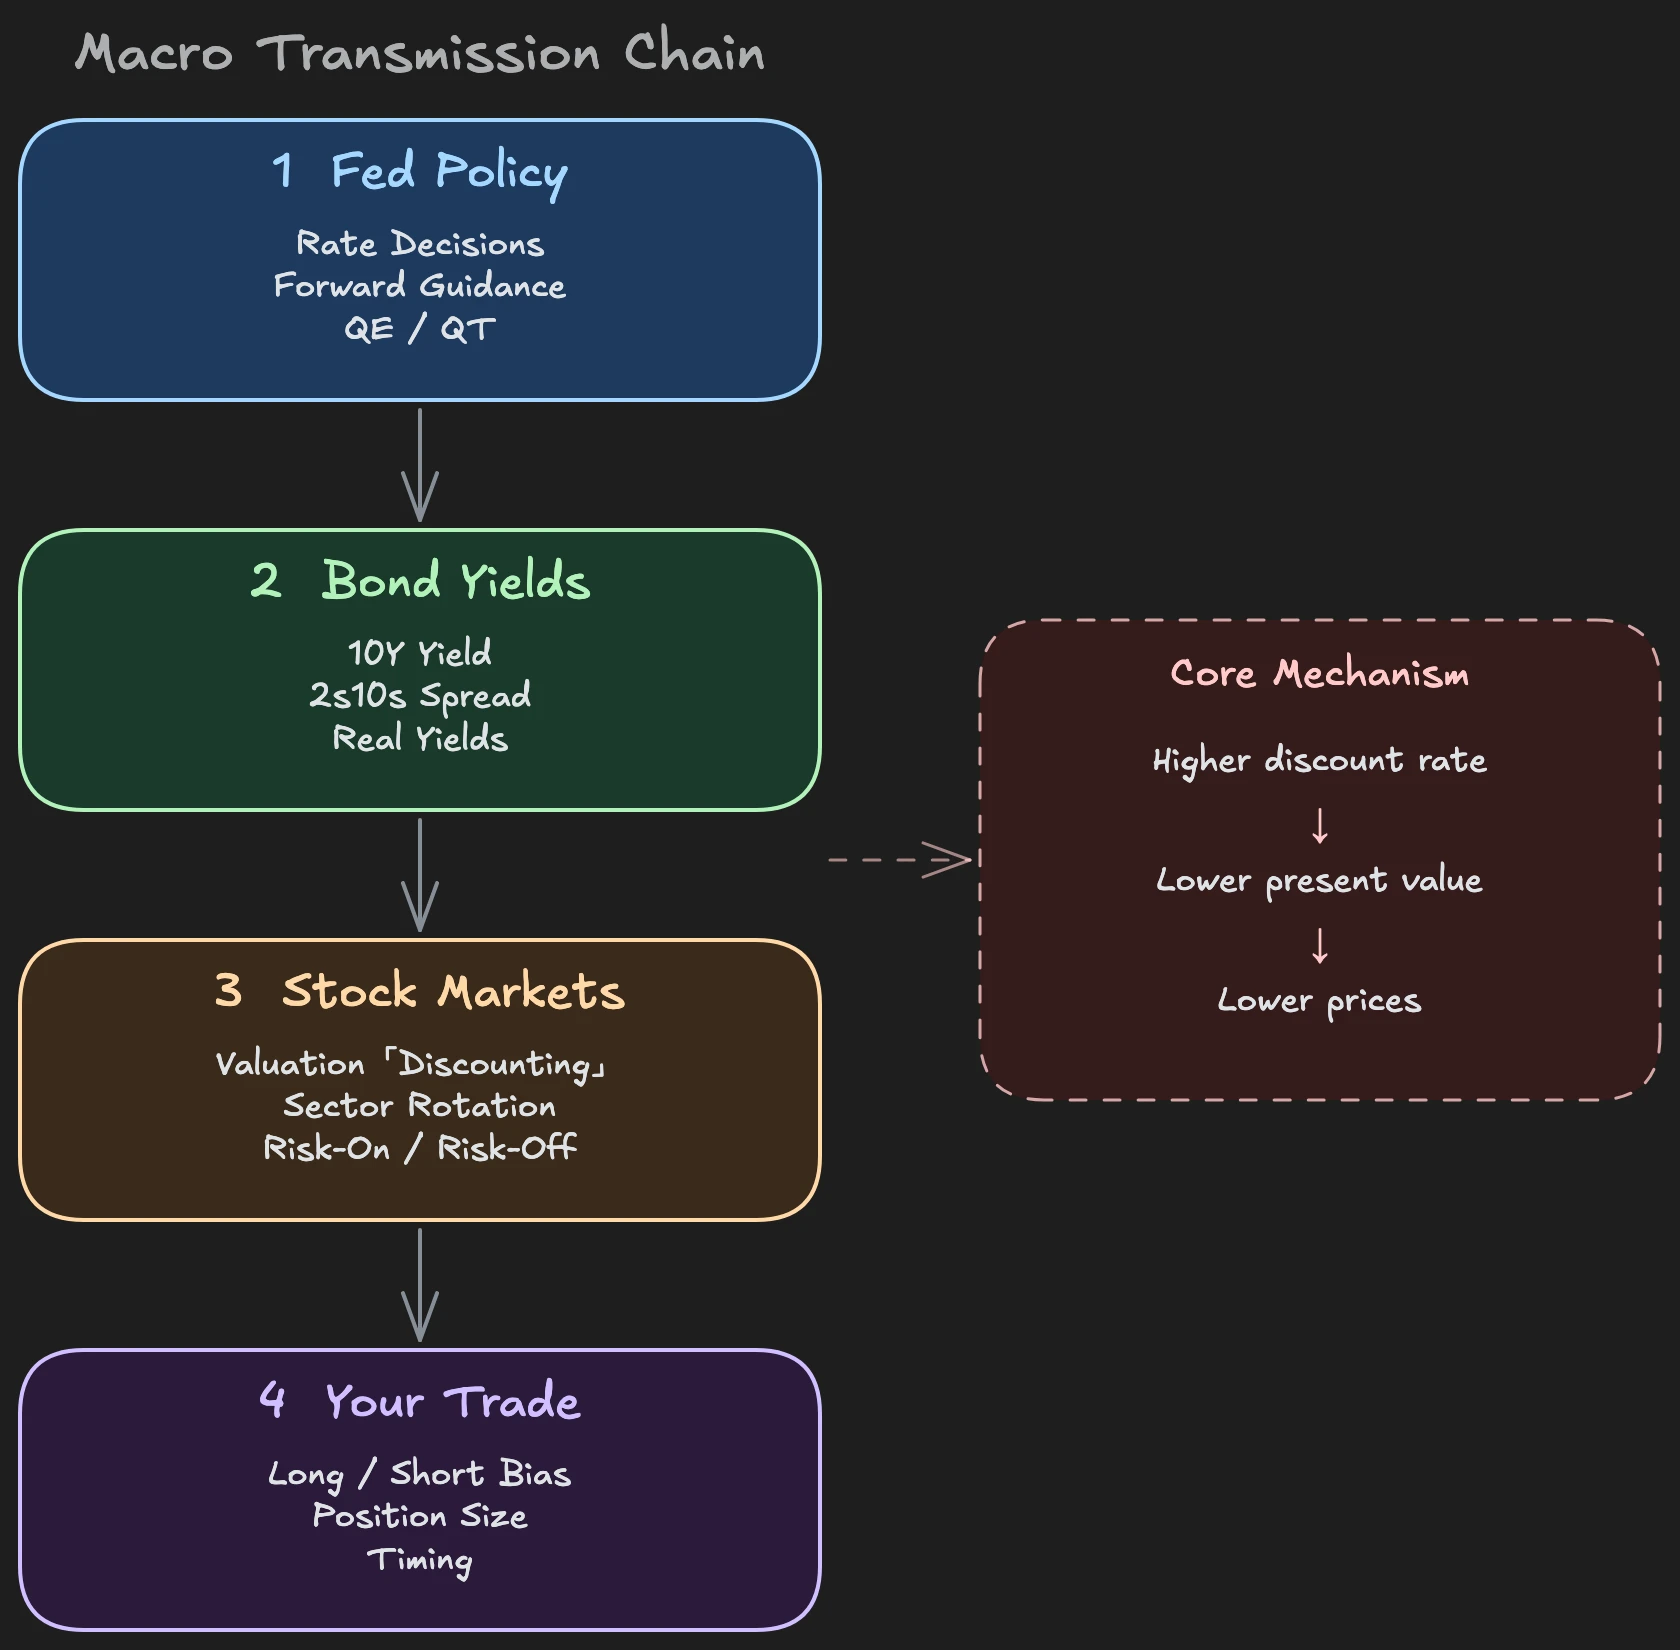
The core principle is simple: Bonds set the "cost of money." Every asset is priced RELATIVE to the risk-free rate. When you buy a stock, you are essentially buying a yield premium over the risk-free rate. When this rate rises, the stock must deliver more to remain attractive. When it falls, less is enough.
The transmission works like this: Rising yields mean higher borrowing costs. Companies that finance growth with debt face headwinds. Their valuations fall because future cash flows are discounted more heavily. Falling yields reverse this: Money becomes cheaper, growth stocks benefit, NQ rises.
This is not correlation. This is causality. The transmission mechanism is direct. When the 10-year US Treasury yield rises by 20 basis points, tech valuations fall because their future profits are worth less today. This does not happen coincidentally at the same time. One causes the other.
No institutional desk trades stocks without a bond screen. When a portfolio manager builds a position in the Nasdaq, they have the yield curve in view. Retail traders without a bonds dashboard are flying blind. The NQ is particularly rate-sensitive because tech valuations have long-term duration. Small rate changes create large price effects.
Bonds, Interest Rates, and Yields: The Basic Concepts
Before you can use bonds as trading context, you need to understand five concepts. Not as academic knowledge, but as tools for your daily workflow.
Bond: A debt instrument. The government or a company borrows money from investors. In return, it pays a fixed coupon (interest rate) and at maturity returns the capital. A 10-year US Treasury with a 4% coupon pays you 4% on your invested capital each year.
Coupon vs Yield: The coupon is fixed. It is set at issuance and never changes. The yield, on the other hand, changes daily with the market price of the bond. When many investors want to buy a bond, its price rises, and the yield falls. When they sell, the price falls, and the yield rises.
Inverse Relationship: Bond price and yield always move in opposite directions. Simple example: A bond with a 4% coupon costs 100. If the price falls to 95, you still get the same 4% coupon, but on less invested capital, so the effective yield rises. If the price rises to 105, the yield falls. If you have bond futures like /ZN on your screen, remember: /ZN rises = yields fall. /ZN falls = yields rise.
Government Bonds vs Corporate Bonds: Government bonds (Treasuries) are considered the risk-free benchmark. Corporate bonds add a credit spread (the additional yield the market demands for credit risk). High-yield bonds (junk bonds) add even more. For day traders, primarily government bonds are relevant because they set the benchmark. If you are doing Futures Trading, the Treasury market is your macroeconomic compass.
Duration (simplified): The longer a bond's maturity, the more strongly it reacts to rate changes. The 10-year bond moves significantly more with a rate change than the 2-year. This is important because different maturities send different signals.
The Three Interest Rates Every Trader Must Know
You do not need to understand the entire bond market. Three numbers are enough to cover 90% of the macroeconomic context for your trading.
1. US 10-Year Treasury Yield
The 10-year US Treasury yield is THE global benchmark for pricing risk. When financial media talk about "rising interest rates," they usually mean this yield. It influences mortgage rates, corporate financing, stock valuations, and currency rates. For day traders: Watch /ZN (10-Year Treasury Future) on your platform or the US10Y ticker on TradingView. The direction of the 10-year yield gives you the overarching wind for your equity trades.
2. 2s10s Spread (Yield Curve)
The yield curve is the difference between the 2-year and 10-year yield. Normal is a positive spread: Long-term yields higher than short-term, because investors demand more for longer commitment. When this reverses (inversion), the market signals recession risk.
But here comes the counterintuitive part: The inversion itself is not the immediate problem. The normalization afterwards, when the spread goes from inverted back to positive, often marks the actual start of the recession. Most traders only look at the inversion and forget that the real danger lies in the resolution.
3. Real Yields
Nominal interest rate minus inflation expectations equals the real yield. You can read it via 10-year TIPS (Treasury Inflation-Protected Securities). Negative real yields are bullish for risk assets and gold: Money loses real value, so it flows into assets with return potential. Rising positive real yields create headwinds because risk-free investments suddenly offer real returns.
"No institutional trader I know opens their stock screen in the morning without checking bond yields first. The bond market is the foundation on which everything else stands."
— Marco Bösing, Founder of United Daytraders
How to Integrate Bonds into Your Trading Day
Theory is worthless if you do not integrate it into your daily workflow. I show you the approach I use every morning. It takes no more than 10 minutes per day.
Morning Prep (5 minutes): Before the session you check three things. First: In which direction has the 10-year yield moved since yesterday? Rising = caution on long NQ trades. Falling = long bias has tailwind. Second: Where does the 2s10s spread stand? Third: Are there Fed speakers, bond auctions, or inflation data today? These events can strongly move the bond market intraday.
During the session: Keep /ZN open on a second screen or as a small window. The rule of thumb is simple: /ZN falls (yields rise) = expect headwinds for NQ. /ZN rises (yields fall) = NQ has tailwind. This is not a mechanical rule, but a context filter that improves your hit rate.
On FOMC and CPI days the bond-equity correlation becomes almost mechanical. When CPI data comes in hotter than expected, yields spike within seconds, and NQ falls. When the Fed communicates more dovishly than expected, yields fall, and NQ rises. On these days, the bond screen is not optional, but your early warning system.
Practical conflict filter: When your order flow analysis shows a long setup in NQ, but yields are simultaneously spiking, you have a conflict. The right reaction: Do not trade. Wait until bond and equity signals align. This one filter can save you from many losing trades. Key levels in Volume Profile gain special significance when the bond context confirms the direction.
The Current Rate Regime and What It Means
After the rate hike cycle starting in 2022, we are in an elevated interest rate environment. The central market question is: How long will rates stay at this level?
For NQ traders this means concretely: Economic data that supports "higher for longer" (strong labor market, persistent inflation) creates NQ headwinds. Signals for rate cuts (weaker data, falling inflation) create NQ tailwinds.
Important is the difference: The Fed Funds Rate determines the short end of the yield curve. The long end (10-year) is determined by the market. When both diverge, the yield curve inversion emerges. The market prices the future, the Fed reacts to the present.
The central insight for traders: The bond market prices reality faster than the stock market. When bonds are sold (yields rise) while stocks still rally, the stock rally is living on borrowed time. The divergence between bond and equity signals is one of the most reliable warning signals you can have as a trader.
FAQ: Interest Rates and Bonds for Traders
Do I need to trade bonds to understand them?
No. You read bonds, you do not trade them. For most day traders, it is enough to have /ZN or the US10Y ticker on the watchlist and observe the direction. You do not need to trade bond futures or calculate the fine details of the yield curve. It is about context, not an additional instrument.
Which bond is most important for day traders?
The US 10-Year Treasury. It is the global benchmark for risk pricing and influences practically every other market. If you only watch one number from the bond market, watch this yield.
How does the Nasdaq react to interest rate decisions?
NQ is the most rate-sensitive among the major indices because tech valuations are based on long-term growth expectations. Rate hikes tend to be bearish, rate cuts bullish. But expectations are more important than the decision itself: If the market has already priced in a rate cut and the Fed actually cuts, NQ barely moves. Surprises move the market, not confirmations. How to trade concretely around such events is explained in the article NFP Trading.
In our Macroeconomics course with 20 video lessons you learn how bonds, interest rates, and economic data are connected. On united-daytraders.com you find the program along with over 1,500 additional video lessons from institutional traders.