Order Book Analysis: What the Book Shows You and What It Hides
The order book is the most misunderstood tool in trading. Beginners look at it and think they see supply and demand. They see a wall of 2,000 contracts on the bid and assume price will bounce. Then the wall disappears in a fraction of a second, price drops through, and they wonder what happened. The order book is not an honest representation of market interest. It is a battlefield where real orders, fake orders, and hidden orders coexist. If you want to trade based on the book, you need to understand all three.
Risk Disclaimer: Trading futures and other financial instruments involves significant risk of loss. Past results are not indicative of future performance. Only trade with capital you can afford to lose.
Resting Orders and the Illusion of Liquidity
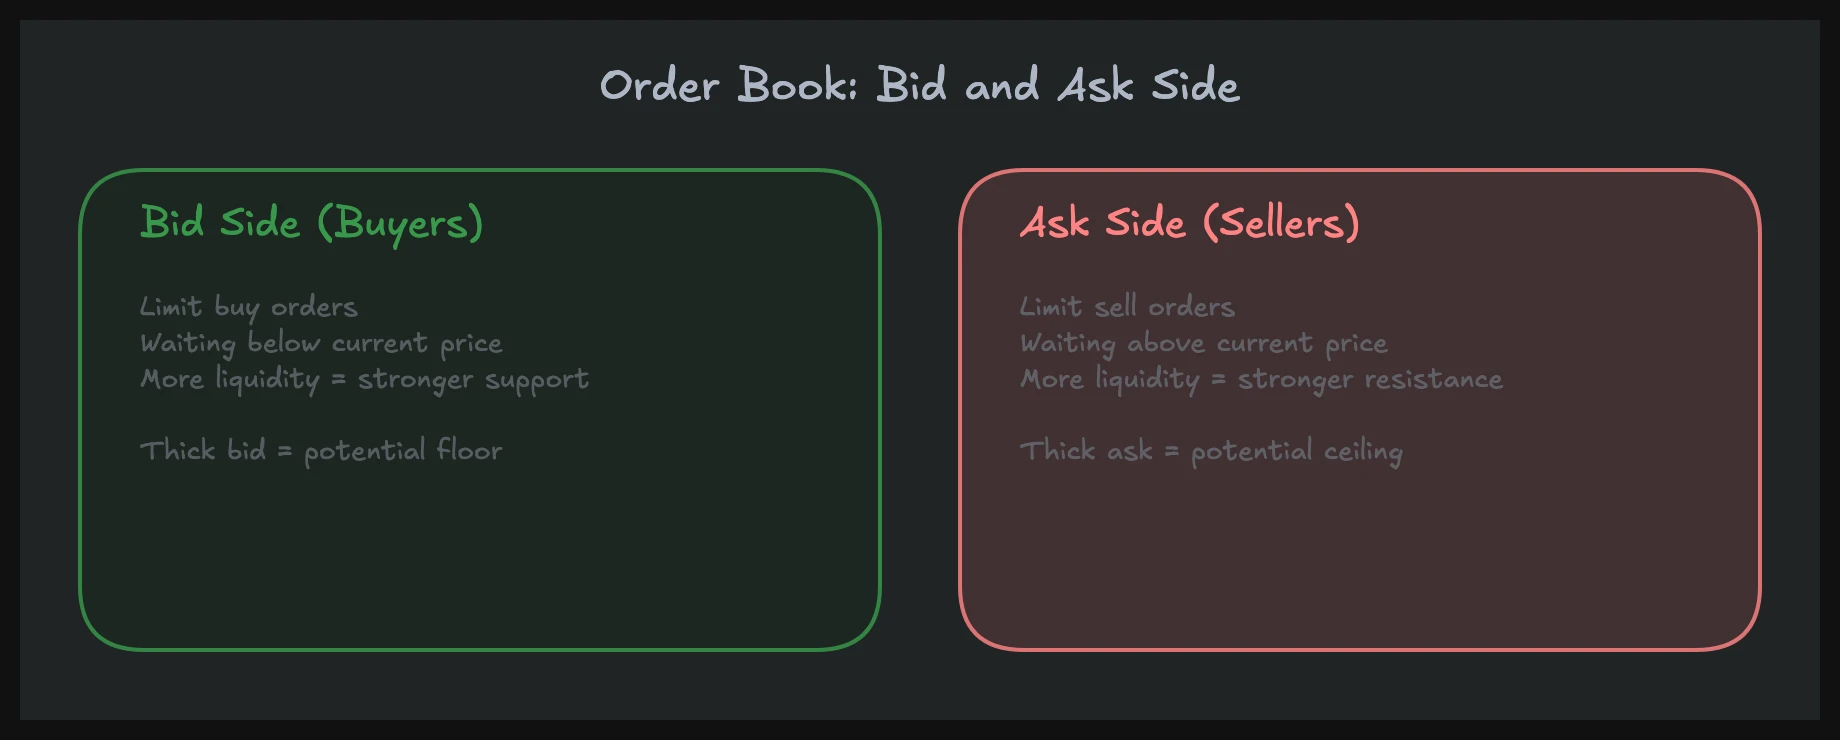
The order book, also called Level 2 or the DOM (Depth of Market), shows all resting limit orders at each price level. Bids sit below the current price, asks sit above. The visual impression is straightforward: more bids than asks should mean buying pressure. More asks than bids should mean selling pressure.
This logic is wrong.
Resting orders are intentions, not commitments. A limit order can be placed and canceled within milliseconds. In NQ futures, I regularly see levels with 300+ contracts on the bid that vanish completely before a single contract trades there. The orders were never meant to be filled. They were placed to create an impression.
The critical distinction is between resting liquidity and executed liquidity. Resting liquidity is what sits in the book. Executed liquidity is what actually trades, visible on the tape (Time & Sales). If you only look at the order book, you see what people want you to see. If you look at the tape, you see what actually happened. This is the foundational concept behind reading visible versus invisible liquidity correctly.
In order flow trading, the executed side always tells the real story. The book tells a story that may or may not be true. That difference is everything.
Spoofing: Fake Orders That Move Real Prices
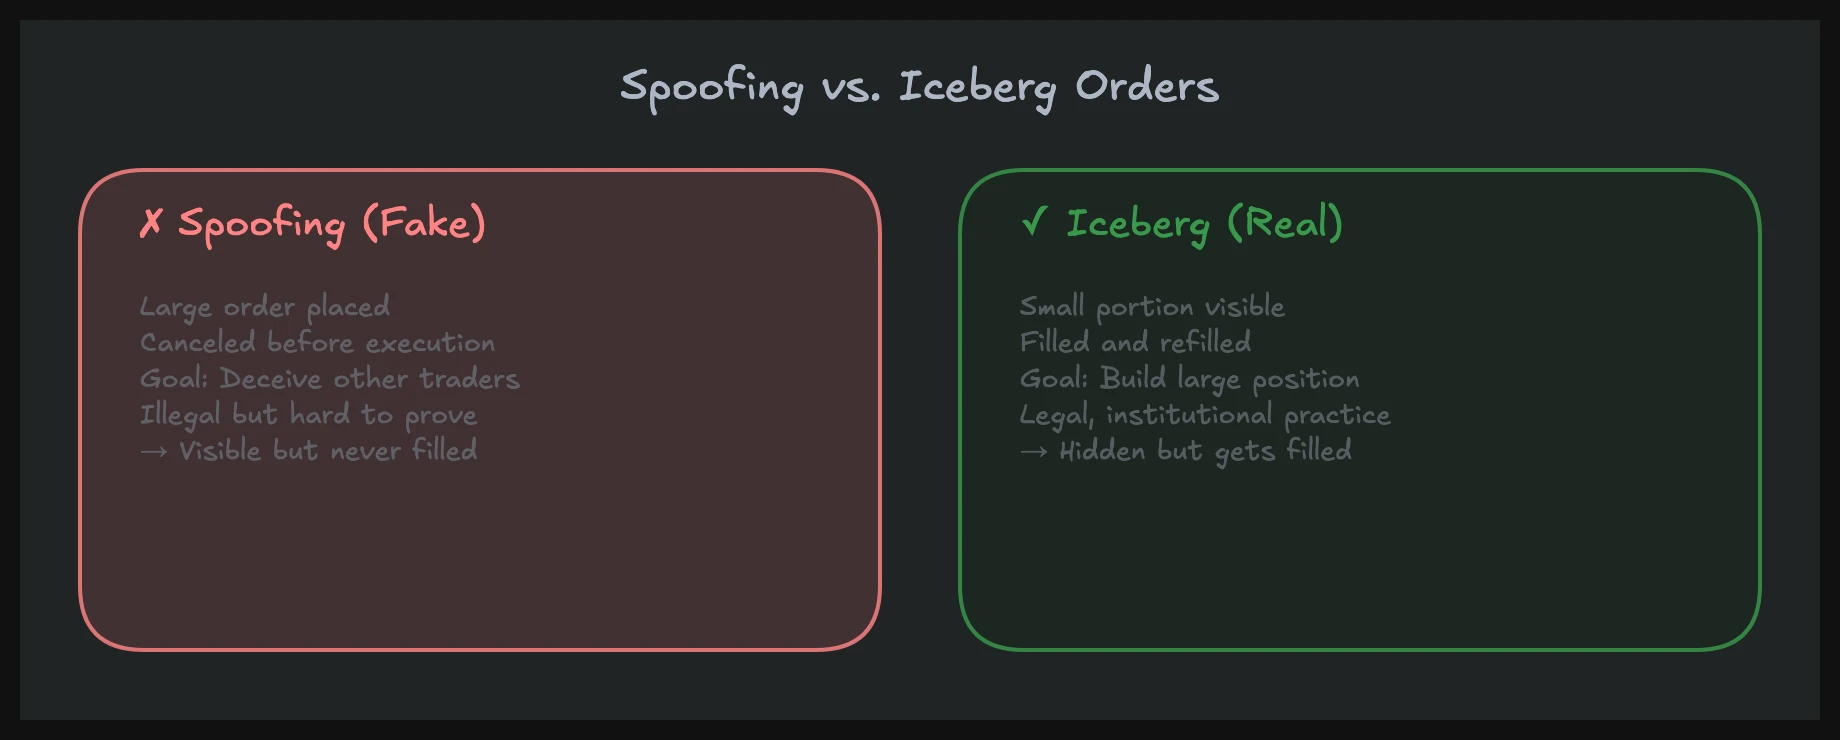
Spoofing is the practice of placing large orders with no intention of letting them fill, purely to manipulate price. A spoofer places a wall of 1,500 contracts on the ask side. Other market participants see this wall and assume heavy selling pressure. Algorithms react. Retail traders react. Price drifts lower. The spoofer then buys at the lower price and cancels the fake sell wall.
This is illegal under the Dodd-Frank Act of 2010. Section 747 explicitly prohibits spoofing in futures markets. The CFTC (Commodity Futures Trading Commission) has prosecuted dozens of cases. The most prominent was Navinder Sarao, who spoofed ES futures from his parents' house in London and was linked to the 2010 Flash Crash. He was convicted in 2016 and ordered to pay $25.7 million. JP Morgan paid $920 million in 2020 to settle spoofing charges across precious metals and Treasury futures. These are not edge cases. Spoofing is systemic, and despite prosecution, it continues.
How do you detect spoofing in real time? There are patterns to watch for. Large resting orders that appear suddenly, sit for a few seconds, and disappear before price reaches them are classic spoofing behavior. In my experience trading NQ, the pattern often looks like this: a large ask order appears three to five ticks above the current price. Price drifts down. The moment price moves enough, the order is pulled. The key giveaway is the order-to-trade ratio. If a level consistently shows large size but almost nothing trades there, that size was never real.
Tools like Bookmap visualize historical order book data as a heatmap, making it easier to see orders that appeared and vanished. You can literally watch the ghost liquidity fade from the screen. But no tool will label something "spoof" for you. You need context and pattern recognition.
The practical takeaway: never base a trade on resting liquidity alone. A wall of contracts in the book means nothing until those contracts actually trade. What matters is what happens on the tape and in delta.
Iceberg Orders: Real Size Hiding in Plain Sight
Iceberg orders are the opposite of spoofing. Where spoofing shows fake size, icebergs hide real size. An iceberg order displays only a small portion of the total order in the book. When that visible portion gets filled, the next slice automatically appears at the same price.
Institutional traders use icebergs constantly. If a fund needs to buy 5,000 ES contracts, showing that size in the book would move the market against them before they are filled. Instead, they show 50 contracts at a time. Each time those 50 get filled, another 50 appear. To someone watching the tape, they see the same price level absorbing aggressive selling over and over, but the book never shows unusual size.
This is the connection to tape reading. The book looks normal. The footprint looks normal. But Time & Sales shows that the same bid level has been hit and refilled 40 times. That is not coincidence. That is an institution accumulating a position. In our NQ Masterclass, we teach that orders that systematically refill at the same level are institutional size hiding, and that recognition changes how you interpret the entire order book.
Detecting icebergs requires watching the tape at specific levels. If a price that should break keeps holding, and you see a steady stream of fills at that price without the book showing large size, you are likely looking at an iceberg. The level absorbs aggression without showing its hand.
In practice, icebergs are bullish when they sit on the bid (absorbing sells) and bearish when they sit on the ask (absorbing buys). They represent conviction. Someone is committed enough to absorb thousands of contracts without revealing their position. When you spot this, you generally want to trade on the iceberg's side.
Layering: Spoofing with Structure
Layering is a more sophisticated version of spoofing. Instead of placing one large order at a single level, the manipulator stacks multiple orders across several price levels, creating the appearance of deep, genuine liquidity on one side of the book.
A layering pattern in NQ might look like this: 200 contracts appear at 18,450, 180 at 18,451, 220 at 18,452, 150 at 18,453. Suddenly the ask side looks heavily loaded. Algorithms and traders interpret this as strong selling interest. Price drops. As soon as the manipulator has filled their buy orders below, all those layered asks are canceled simultaneously.
The CFTC treats layering the same as spoofing. Both fall under market manipulation. The difference is tactical: layering looks more organic because it is spread across multiple levels. A single 800-contract wall at one price is suspicious. Four moderate-sized orders across four levels looks like normal market depth. That is precisely why it works.
From a detection standpoint, look for symmetry and timing. Genuine limit orders at different levels are placed independently by different participants at different times. Layered orders tend to appear and disappear together. If four or five levels of size show up within the same second and vanish within the same second, that is not independent market activity.
Understanding manipulative order flow, including spoofing, layering, and bluffing, is a core part of reading the market at a professional level. These are not rare events. In liquid futures like NQ, ES, and CL, manipulative patterns occur daily. You do not need to identify every instance. You need to understand that the book can lie, so you never rely on it as your sole data source.
What to Actually Trust
If the order book can be spoofed, layered, and manipulated, what can you trust? Executed trades. Once a trade prints on the tape, it is real. Someone bought, someone sold, contracts changed hands. That data cannot be faked.
This is why professional order flow analysis always prioritizes Time & Sales and delta/CVD over the resting book. The book shows intentions that may be fake. The tape shows reality. When price approaches a level and you see heavy execution, absorption, or stop runs on the tape, that is actionable information.
My approach is to treat the order book as supplementary context. I watch it for unusual changes and for iceberg activity. But I never enter a trade because the book looks a certain way. I enter trades because of what actually executed.
In our mentoring program, you'll learn these concepts in over 1,500 video lessons with real chart examples.
FAQ
Is spoofing still a problem even though it is illegal?
Yes. Despite the Dodd-Frank Act and active CFTC enforcement, spoofing remains common in futures markets. Prosecution typically targets the most egregious cases. Smaller-scale spoofing happens constantly in NQ, ES, and other liquid contracts. The practical response is not to report every instance but to stop trusting the order book at face value and focus on executed trades instead.
How can I tell the difference between an iceberg order and normal buying?
Normal buying at a level depletes the visible liquidity and price moves through. An iceberg repeatedly refills at the same price. You see a steady stream of fills on the tape at one level without the order book showing large size. If a level absorbs hundreds or thousands of contracts without breaking, that consistent refill pattern points to hidden institutional size.
Do I need special software for order book analysis?
You need a platform that shows Level 2 data and Time & Sales at minimum. Tools like Bookmap add historical order book visualization, which helps spot spoofing patterns after the fact. ATAS and Sierra Chart offer footprint and DOM analysis. But the most important skill is understanding the mechanics. No software will tell you whether an order is real or fake. That judgment comes from watching thousands of hours of live order flow and learning the patterns.