Stop Runs in Trading: How Liquidity Gets Hunted
Your stop loss gets triggered and immediately after, the market turns. This isn't a coincidence and not manipulation against you personally. Stop runs are a fixed part of market structure. Those who understand why they happen can use them instead of falling victim to them. This understanding is a central building block in order flow trading and is particularly pronounced in NQ, where the thin liquidity makes stop runs more frequent and sharper.
Risk Disclaimer: Trading futures and other financial instruments carries substantial risk of loss. Past results are not indicative of future performance. Only use capital you can afford to lose.
What a Stop Run Really Is
A stop run occurs when the price reaches a level where stop-loss orders are concentrated. These stops get triggered and converted into market orders. This creates a sudden, aggressive order flow in one direction. But behind this flow stands no trader who consciously wants to buy or sell. These are forced exits.
Imagine a group of traders has built short positions and placed their stop-loss orders above a certain level. The price rises, the stops get hit. Now these stops become market buy orders and the market shoots upward. This looks like strong buying pressure. The entire trading world sees this move and thinks: there are real buyers here.
But obviously this isn't a sustainable buyer. These are just positions being forcibly closed. Still, the price action signals a trend to the whole trading world. And that's exactly what makes stop runs so dangerous and simultaneously so valuable: they create a signal that deceives. The price action is the price action. No one tells you whether real buyers are behind it or just stopped-out shorts.
Released Liquidity: What Happens After the Stop Run
The truly interesting thing about a stop run isn't the move itself. It's what happens afterward. Because when no real follow-through comes after the spike, exactly the constellation emerges that makes reversal setups so reliable. And that's exactly where superficial knowledge about "stop hunting" separates from real understanding of market structure.
When stops get triggered and the market shoots upward, this move is first nothing other than released liquidity, but no one is standing behind it. The shorts were stopped out, their forced buys drove the price up. But now? Who buys next?
If no one follows through, if no real market participant is willing to go long at these higher prices, then something predictable happens: the market world stops trading, holds back, and then the thing falls like a stone. That's the pattern: stop run, released liquidity, no follow-through, reversal.
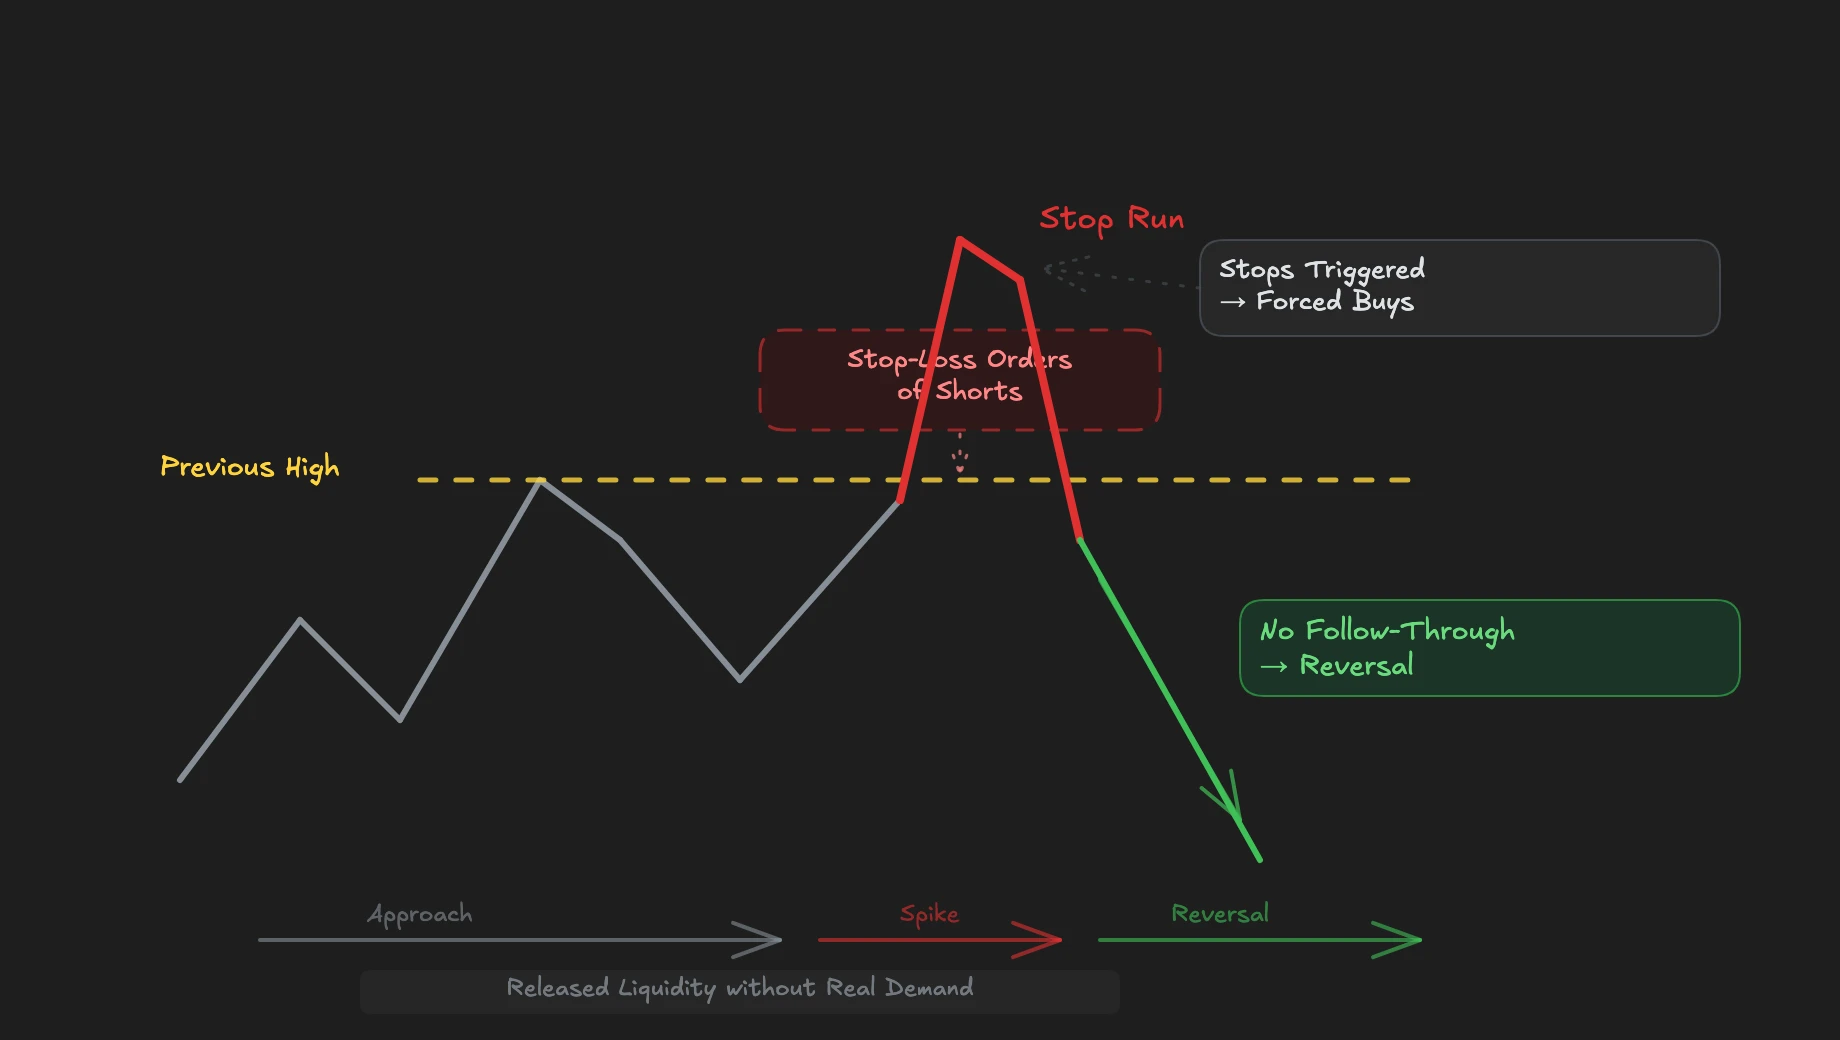
This mechanism is the reason so many traders experience the market turning right after their stop loss. The stop run creates the move. But because no real demand stands behind the move, the reversal probability is high. The stop run itself creates the opportunity for the trade in the opposite direction.
Visible and Invisible Liquidity
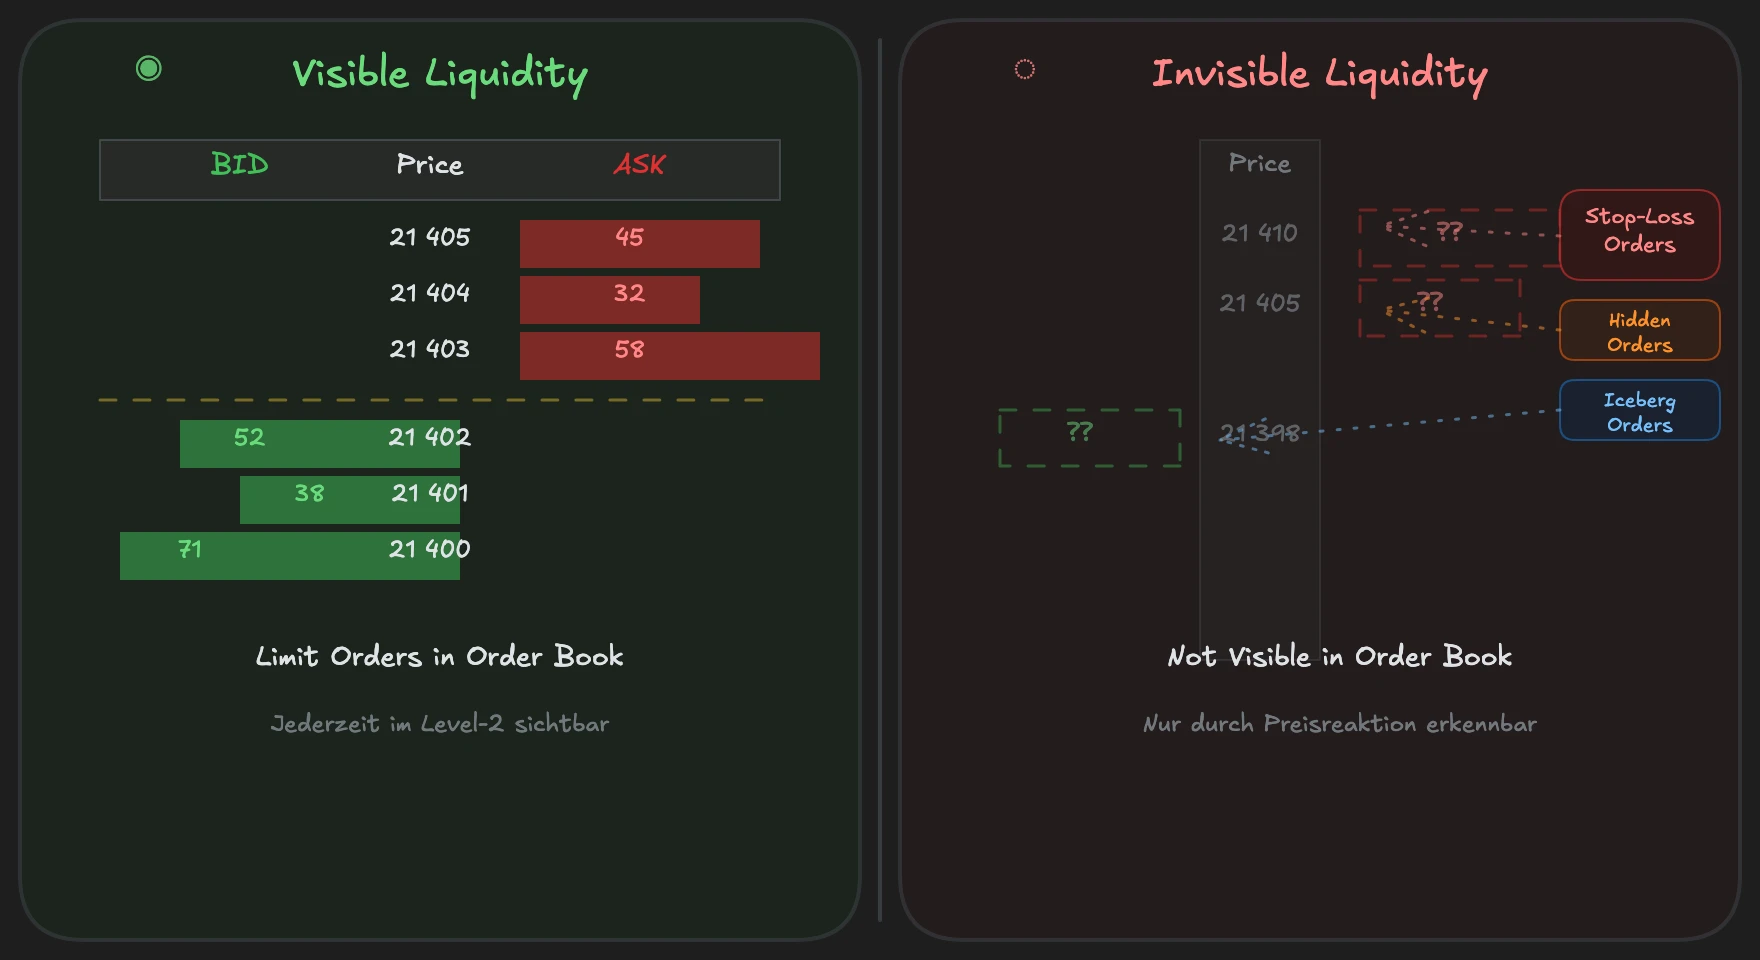
To truly understand stop runs, you need to know the difference between visible and invisible liquidity. Visible liquidity is everything you see in the level-2 order book: limit orders on the bid and ask side. For this, you only need a data feed and the right software. These are always only limit orders. We can't see stop orders.
Invisible liquidity is exactly that: invisible. Stop-loss orders, hidden orders, iceberg orders. We can think something is there, but we don't know. We can guess, we can logically deduce where stops might lie, but we can't validate it.
And here lies a widespread misconception in the retail world: many traders believe that at high and low points, enormous liquidity lies that gets "fished" by institutions. There is liquidity there, yes. But there isn't so much liquidity that it's worthwhile on its own. If you look at the actually traded volume at these points, you often see less than in the areas below or above.
Institutional traders don't hunt the last few stops at a high or low point. You position yourself where the other side is also present, because only then can you trade without moving prices much. What gets released after the liquidity grab, that's what's decisive.
This means a clear rule for your trading: we will never say, stops must be there, so we trade immediately. Always wait for the reaction. Only when you see in the footprint chart or in the tape what actually happens may you trade. The Volume Profile helps you identify zones with real traded volume instead of speculating on suspected stops.
How to Use Stop Runs in Practice
The first step is identifying levels where stops are likely to lie: previous highs and lows, sideways ranges, round numbers, trendlines. Stops collect especially at trendlines because many traders place their protection there. But treat these levels as possibilities, not certainties. You don't know if stops are there. You suspect it.
The second step is the more important one: observe what happens after the level is taken. Does real follow-through come? Do you see sustained aggression in the direction of the breakout in the footprint chart or with big trades? Or does the move stop immediately?
Here comes an analysis logic that surprises many: if you get a stop run on the upside, that doesn't mean many shorts traded here. First, very many longs traded. Otherwise, this stop run wouldn't happen at all. The shorts only came afterward. You always have to think around the corner a bit. The institutional reading is often the opposite of the obvious.
If no follow-through comes, the released liquidity is your signal. The forced buys moved the price, but no one stands behind it. This is a potential reversal setup. If, on the other hand, real follow-through comes, if you see in the footprint chart that aggressive market orders continue to drive the move and the other side doesn't hold, then it's not a stop run with reversal potential. Then it's continuation and you don't want to trade against it.
Recognizing a Stop Run in Real-Time
In theory, all this sounds logical. But how do you recognize a stop run while it's happening? Three steps help you.
First: observe whether the price quickly and impulsively spikes through a known level, meaning a previous high, a previous low, or a range boundary. This alone isn't proof yet, but it's the first prerequisite.
Second: look at the footprint chart. Do aggressive orders dry up after the spike? If you see that market buys (during an upward spike) immediately decrease and no new aggression comes, the follow-through is missing.
Third: pay attention to speed. Did the move stop immediately? Did the price practically stand still after the spike or even come back directly? If yes, then no real conviction stands behind the move.
When all three points come together, you have a potential stop-run reversal setup. Then you wait for confirmation in the tape or footprint and position yourself in the opposite direction.
The decisive ability therefore isn't predicting stop runs. It's correctly reading what the market shows you after the stop run. Prediction is speculation. The reaction afterward is information.
FAQ: Stop Runs
Are My Stops Being Targeted?
Not personally, but structurally yes. Institutional traders need liquidity to build or unwind large positions. Stops at obvious levels provide exactly this liquidity. It's not a conspiracy against you. It's market structure: institutions test the market, accumulate positions, and the resulting moves trigger stops, which in turn release liquidity. They then use this released liquidity for their actual positioning.
How Do I Set My Stop Loss to Avoid Stop Runs?
Place your stop loss beyond logical structure levels, not directly at them. If every trader has their stop at the same swing low, yours should lie below it. Use Volume Profile to identify real support and resistance zones. High volume nodes show you where a lot was actually traded, not just where the price was briefly. And accept that some stops will get hit. Risk management means choosing your position size so that individual stop-outs don't matter.
Can I Trade Stop Runs on MNQ the Same Way?
Yes. The Micro E-mini Nasdaq (MNQ) trades at the same exchange (CME) as NQ and uses the same data feed. The price movements, order flow patterns, and stop-run mechanisms are identical. The only difference lies in contract size: one point in MNQ is worth 2 dollars instead of 20 dollars in NQ. This makes MNQ ideal if you want to trade stop-run setups with smaller risk. The analysis stays exactly the same. You can find more on this in our article on Micro Futures Trading.
If you want to apply the concept of stop runs to concrete setups, check out our 3 Nasdaq Trading Strategies that build directly on these mechanisms.
In our mentoring program, the NQ Masterclass devotes 5 lessons to the topic of stop runs, including a custom indicator for recognition. In the Bootcamp, you learn the concept of visible and invisible liquidity from the ground up.