Reading the Chart Story: How the Market Tells You What Happens Next
Chart story trading is the skill of connecting individual market events into a coherent narrative that reveals what happens next. It is not about what a single bar shows. It is about what the sequence of events since the open tells you about the intentions of large market participants. The chart story is one of the core concepts in my trading approach, and it changes how you read every session.
Risk Disclaimer: Trading futures and other financial instruments involves significant risk of loss. Past results are not indicative of future performance. Only trade with capital you can afford to lose.
What a Chart Story Is and Why It Changes Everything
Most traders look at isolated signals. A hammer candle here, a divergence there, a level somewhere else. The problem: isolated signals carry no meaning on their own. A bullish signal in a bearish context is worthless. A bearish print after an hour of institutional accumulation is misleading.
The chart story solves this by treating the entire session as a connected narrative. Think of it like reading a book. You would never rip a single page from the middle and try to understand the plot. Reading market behavior works the same way. The significance of any event only becomes clear through what preceded it.
In my approach, we dedicate 8 full lessons to chart story analysis, including 5 practical marking exercises. There is a reason for that depth: the ability to read the market as a narrative is trainable, but it requires deliberate repetition over an extended period.
The Building Blocks of a Chart Story
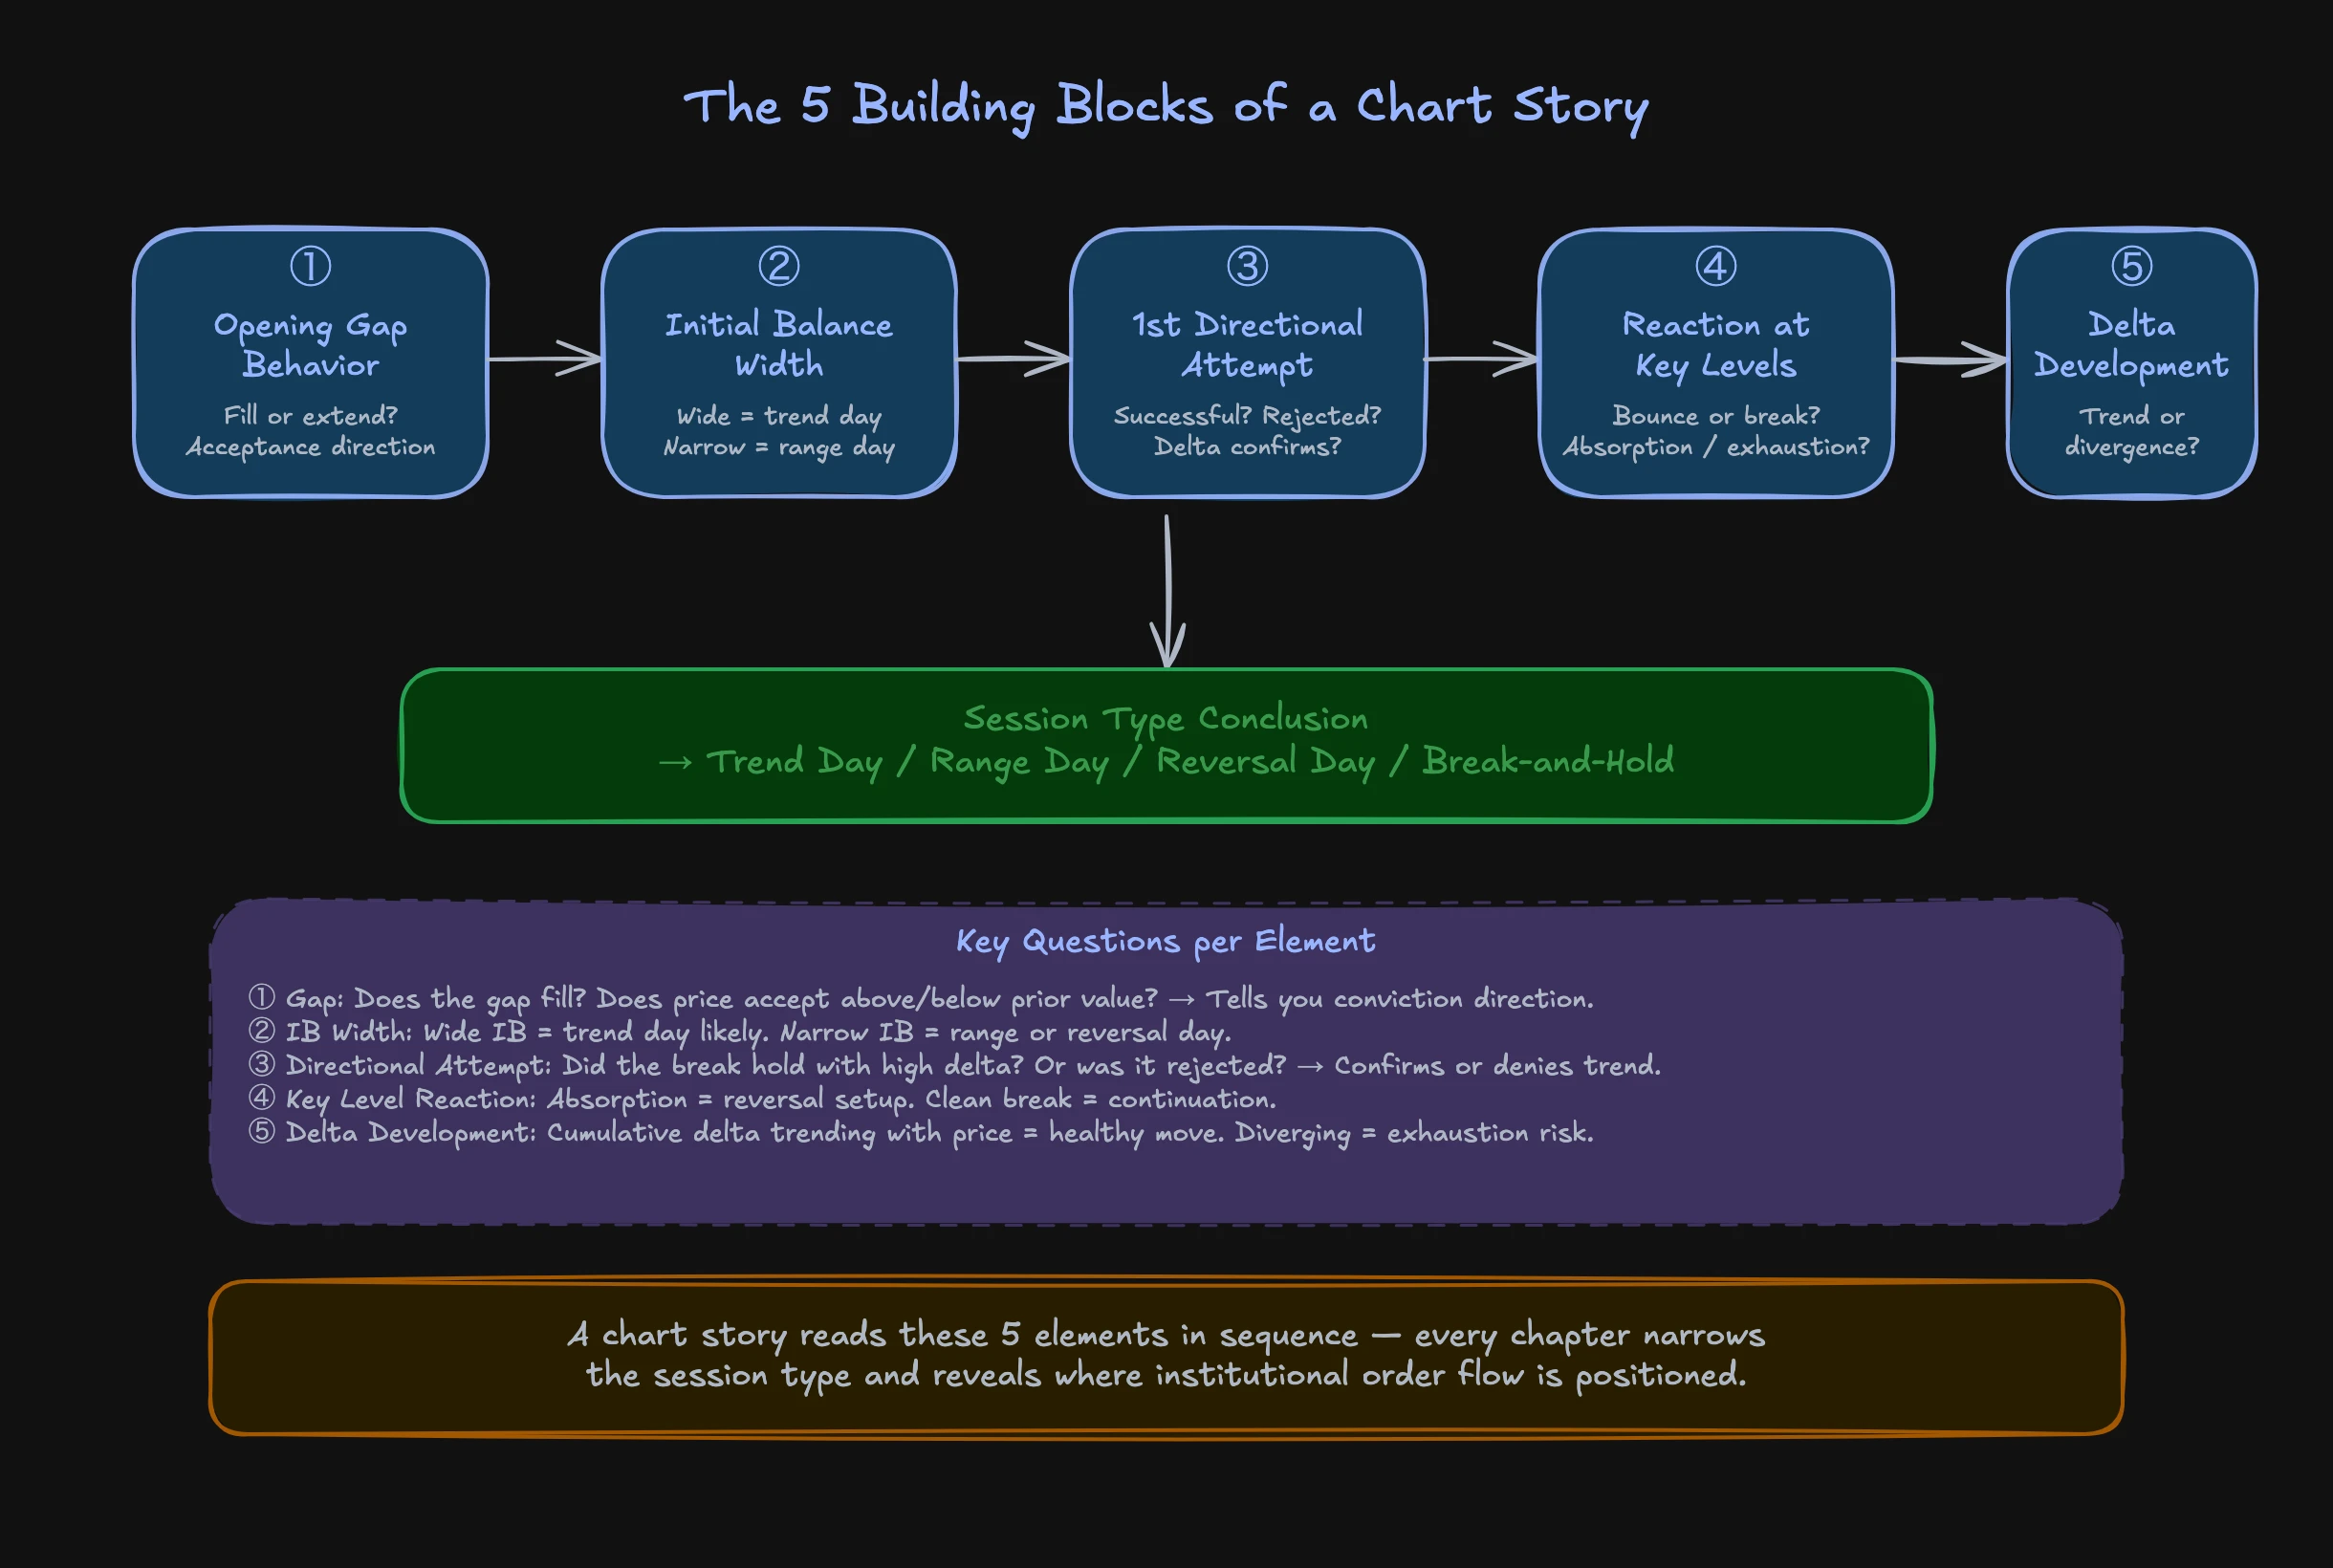
Every chart story is built from a sequence of market events that together form a picture. These are the key building blocks:
Opening Gap Behavior: How does the market open relative to the prior day? Above the Value Area, inside it, or below? And what happens immediately after the open? Gap behavior provides the first clue about whether the market accepts or rejects the prior day's value. In Auction Market Theory, this is one of the most important questions to answer.
Initial Balance (IB) Width: The range of the first 30 or 60 minutes reveals a lot about the potential session type. A narrow IB suggests a possible breakout day. A wide IB suggests rotation. Combined with the opening gap, you already have a preliminary picture.
First Directional Attempt: Which direction does the market try to break first? And how do participants respond to that attempt? A failed breakout to the upside tells a different story than an immediately accepted one.
Reaction at Key Levels: How does price behave at the VAH, VAL, VWAP, or the prior day's high? Is a level respected, absorbed, or broken through? The quality of the reaction matters more than the level itself. This is where absorptions and exhaustions become relevant.
Delta Evolution: How does aggressive volume develop throughout the session? Does cumulative delta rise with price, or does it diverge? The delta evolution either confirms or contradicts the narrative so far.
Example: The Bullish Chart Story
Theory only becomes useful when applied to a real session. Here is a conceptual example on the NQ:
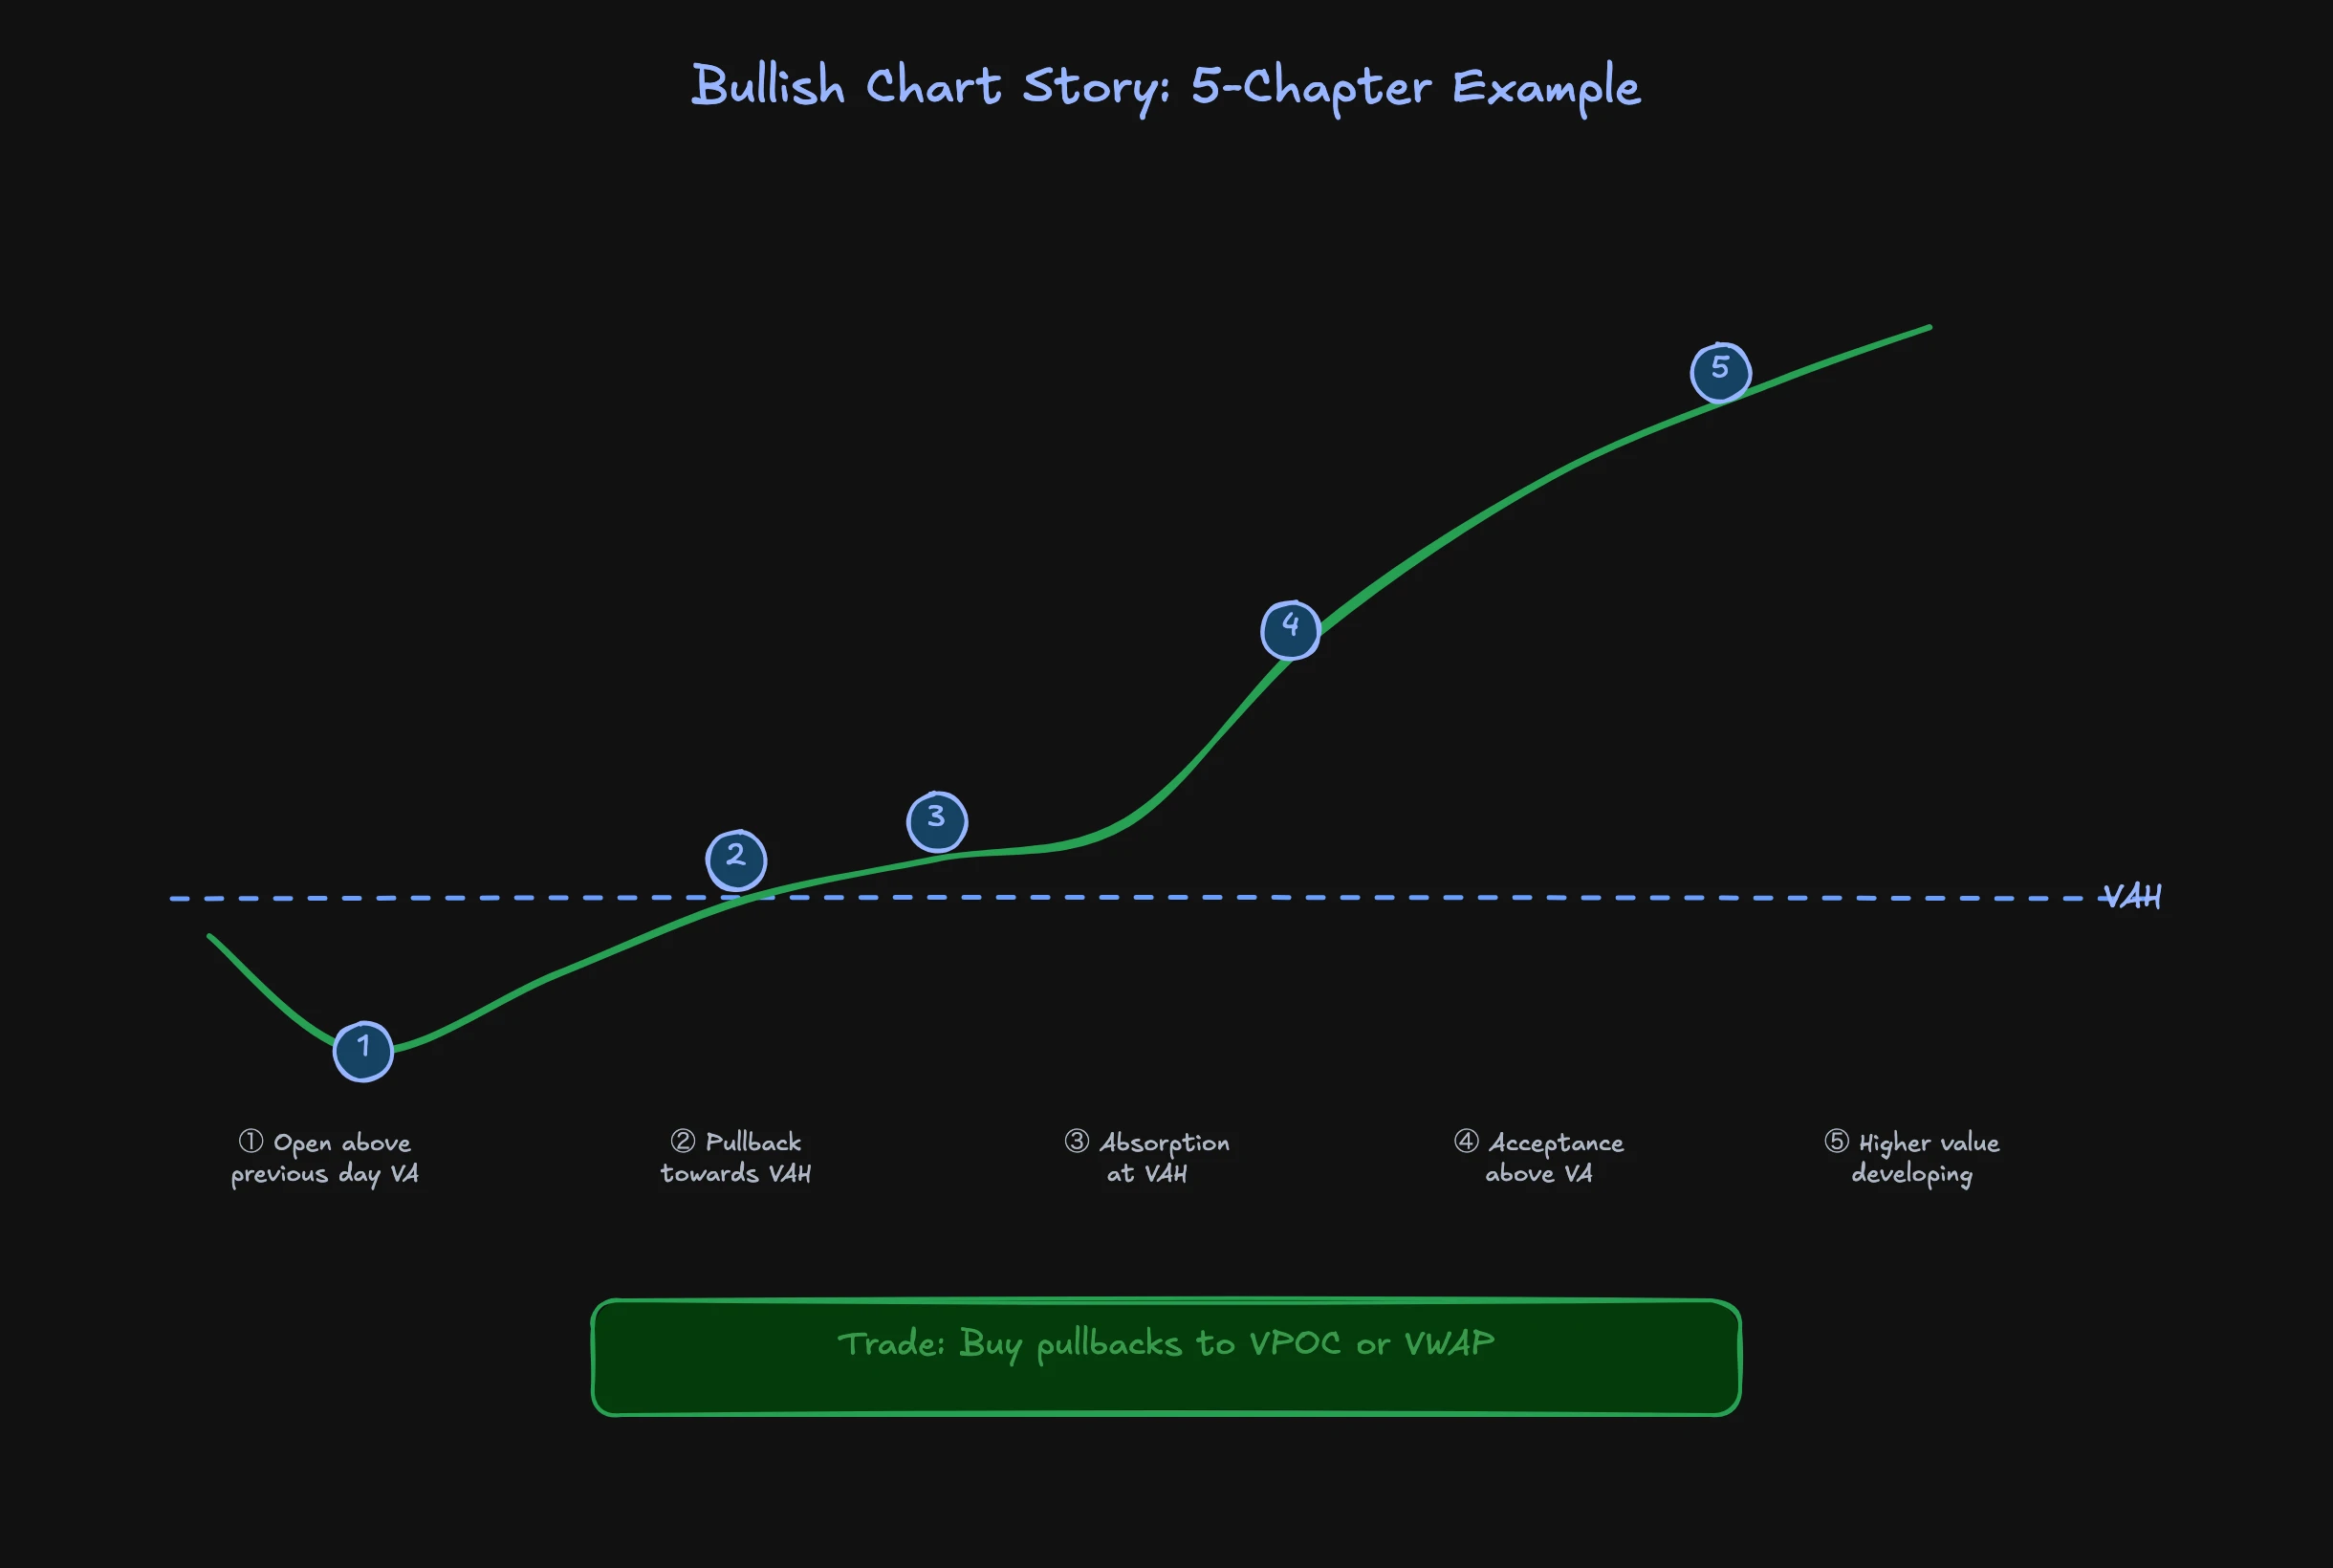
Chapter 1: The market opens above the prior day's Value Area. That alone is a statement: overnight, the market accepted higher value.
Chapter 2: In the first few minutes, there is a pullback attempt toward the VAH. Price drops but does not cleanly reach the level and turns before getting there.
Chapter 3: At the VAH, absorption appears. Passive buyers absorb aggressive selling volume without price declining. Delta turns positive despite the pullback.
Chapter 4: Price accepts above the Value Area. New value is forming. The Volume Profile shows a developing P-shape.
Chapter 5: Higher value develops. Every pullback finds buyers. VWAP rises steadily throughout the session.
Conclusion: Buy pullbacks to VPOC or VWAP. The chart story is bullish because every single chapter points in the same direction. Not one isolated signal, but the sum of all signals.
That is the core idea: you are not reading one bar. You are reading the entire narrative. And from that narrative, you derive which trades make sense and which do not.
Why the Chart Story Prevents Tunnel Vision
A common trap among traders: fixating on a setup while ignoring context. A stacked imbalance looks bullish, so they buy. But if the entire chart story is bearish, if the market has been seeking lower value since the open and every recovery attempt has failed, then that bullish signal is just a rest stop in a larger downtrend narrative.
The chart story forces you to consider the full picture. It provides the framework into which you place every individual signal. An absorption print at the VAH carries a different meaning in a bullish chart story than in a bearish one.
In practice, you identify market phases faster when you consistently read the chart story. Within 30 minutes of the open, you can estimate whether a range day or a trend day is more likely. Not because a single indicator tells you, but because the sum of events so far paints a clear picture.
Chart Story Analysis as a Trainable Skill
The good news: reading the chart story is not an innate talent. It is a skill you can build systematically. In my experience, something remarkable happens after about 100 marked chart stories: you start recognizing patterns. Certain opening sequences lead to certain session types with high probability.
The key is active marking. After each trading day, you take the chart and write out the story of the session. Not as technical analysis, but as a narrative. What happened? Why? What triggered the next chapter?
After enough repetitions, you develop an intuition for what story the market is currently telling. And you recognize early when the story changes. That is the difference between a trader who reacts to signals and one who understands the market.
This is not something you can shortcut. You cannot read about chart stories and immediately apply the concept. It requires deliberate practice, session after session. But once the pattern recognition kicks in, you will wonder how you ever traded without it.
FAQ
How many chart stories do I need to mark before I start seeing patterns?
In my experience, most traders begin recognizing recurring patterns after about 100 consciously marked chart stories. That sounds like a lot, but at one chart per day, it takes less than five months. The quality of your marking matters more than the quantity.
Does chart story analysis only work on the NQ?
The concept works in any liquid market. Building blocks like opening gap behavior, IB width, and reactions at key levels are universal. The NQ is particularly well-suited because it combines high intraday volatility with clear volume structures.
What do I do when the chart story changes mid-session?
This happens regularly and is not a problem. It is part of the process. When new chapters contradict the previous narrative, you adjust your assessment. A bullish morning can transition into a bearish afternoon session. Flexibility is part of the skill. The ability to recognize a changing narrative quickly is actually one of the most valuable aspects of chart story analysis.
In our mentoring program, you'll learn these concepts in over 1,500 video lessons with real chart examples. The chart story analysis alone includes 8 lessons with 5 practical marking exercises.