Risk of Ruin Formula: Does Your Trading Position Sizing Guarantee Survival?
Risk of ruin is the probability of losing all trading capital — or reaching a critical drawdown threshold — before a statistical edge has time to express itself. It is not intuition. It is not experience. It is math. Two traders can run identical strategies, take identical setups, and achieve identical win rates — yet face completely different survival odds. The only variable that differs: how much they risk per trade.
Risk Disclaimer: Trading futures and other financial instruments carries substantial risk of loss. Past performance is not indicative of future results. Only trade with capital you can afford to lose.
What Risk of Ruin Actually Measures
Most traders invest their improvement effort in the wrong place. They refine entry rules. They hunt for better setups. They argue over win rate percentages. What they almost never do: calculate whether their position sizing actually allows them to survive long enough for their edge to manifest.
This is the central oversight. Every strategy experiences drawdown phases. A system with a 60% win rate will still produce runs of five, six, seven consecutive losses. This is not a malfunction — it is statistical normality. The question is not whether these runs will happen. They will. The question is whether you still have capital left when they end.
Risk of ruin quantifies exactly that: the probability that a losing run depletes your account to a defined threshold before the statistical distribution turns back in your favor. It answers the question: "Do I have enough capital buffer to survive my own strategy?"
The Formula Explained
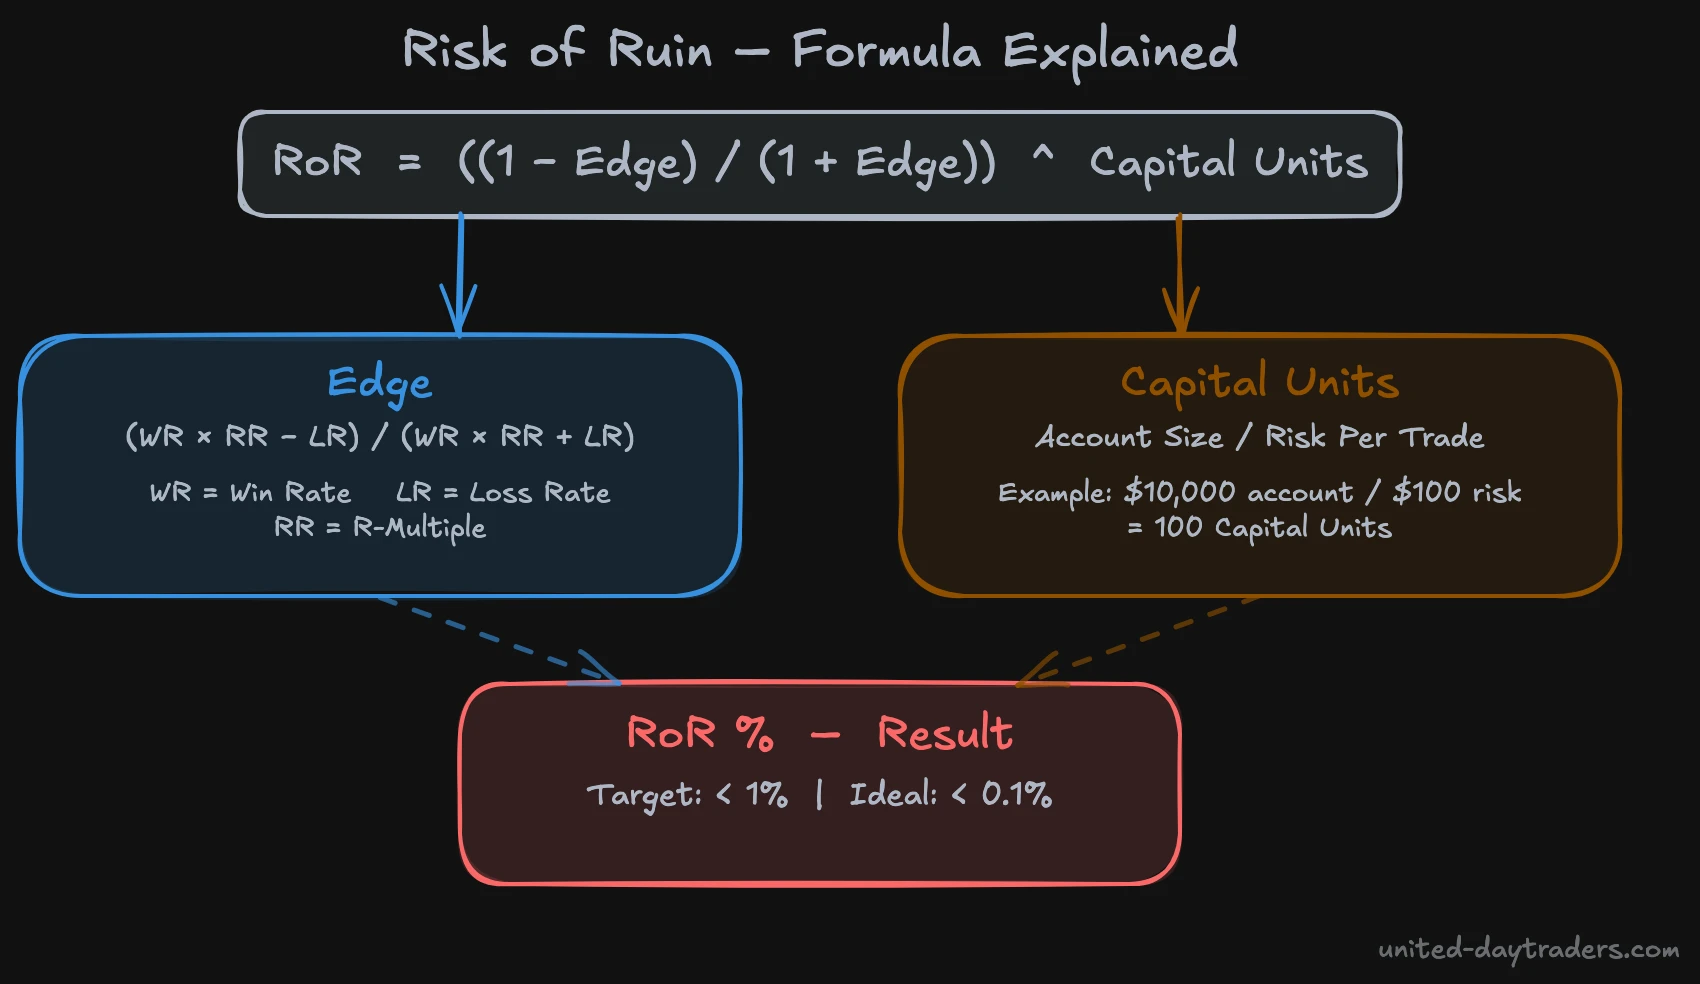
The standard risk of ruin formula is:
RoR = ((1 - Edge) / (1 + Edge)) ^ Capital Units
Where:
- Edge = normalized expectancy of the system
- Capital Units = Account Size ÷ Risk Per Trade
For Edge, we use:
Edge = (WR × RR − LR) / (WR × RR + LR)
Where:
- WR = Win Rate (e.g., 0.55 for 55%)
- LR = Loss Rate = 1 − WR
- RR = R-Multiple (Avg Win / Avg Loss)
Concrete example: A system with 55% win rate and 1.5R reward ratio:
- WR = 0.55, LR = 0.45, RR = 1.5
- Edge = (0.55 × 1.5 − 0.45) / (0.55 × 1.5 + 0.45)
- Edge = (0.825 − 0.45) / (0.825 + 0.45)
- Edge = 0.375 / 1.275 ≈ 0.294
Capital Units at 1% risk per trade: 100 / 1 = 100 Units
RoR = ((1 − 0.294) / (1 + 0.294)) ^ 100
    = (0.706 / 1.294) ^ 100
    = (0.5456) ^ 100
    ≈ 0.01%
Why Most Traders Never Run This Calculation
The honest answer: because the formula is confrontational. It forces you to look at a number that tells you whether your current sizing is structurally dangerous — regardless of how good your setups feel.
Most retail traders choose position size by feel. Or they copy what someone else does. "Two percent sounds reasonable" is not a risk management framework. It is a rule of thumb with no mathematical foundation behind it.
The formula makes visible what intuition keeps hidden: that two traders with the same strategy, same win rate, and same R-multiple can have completely different survival probabilities — determined entirely by sizing. One of them is playing the same game with a seat belt. The other is not.
Two Traders, One Strategy, Different Outcomes
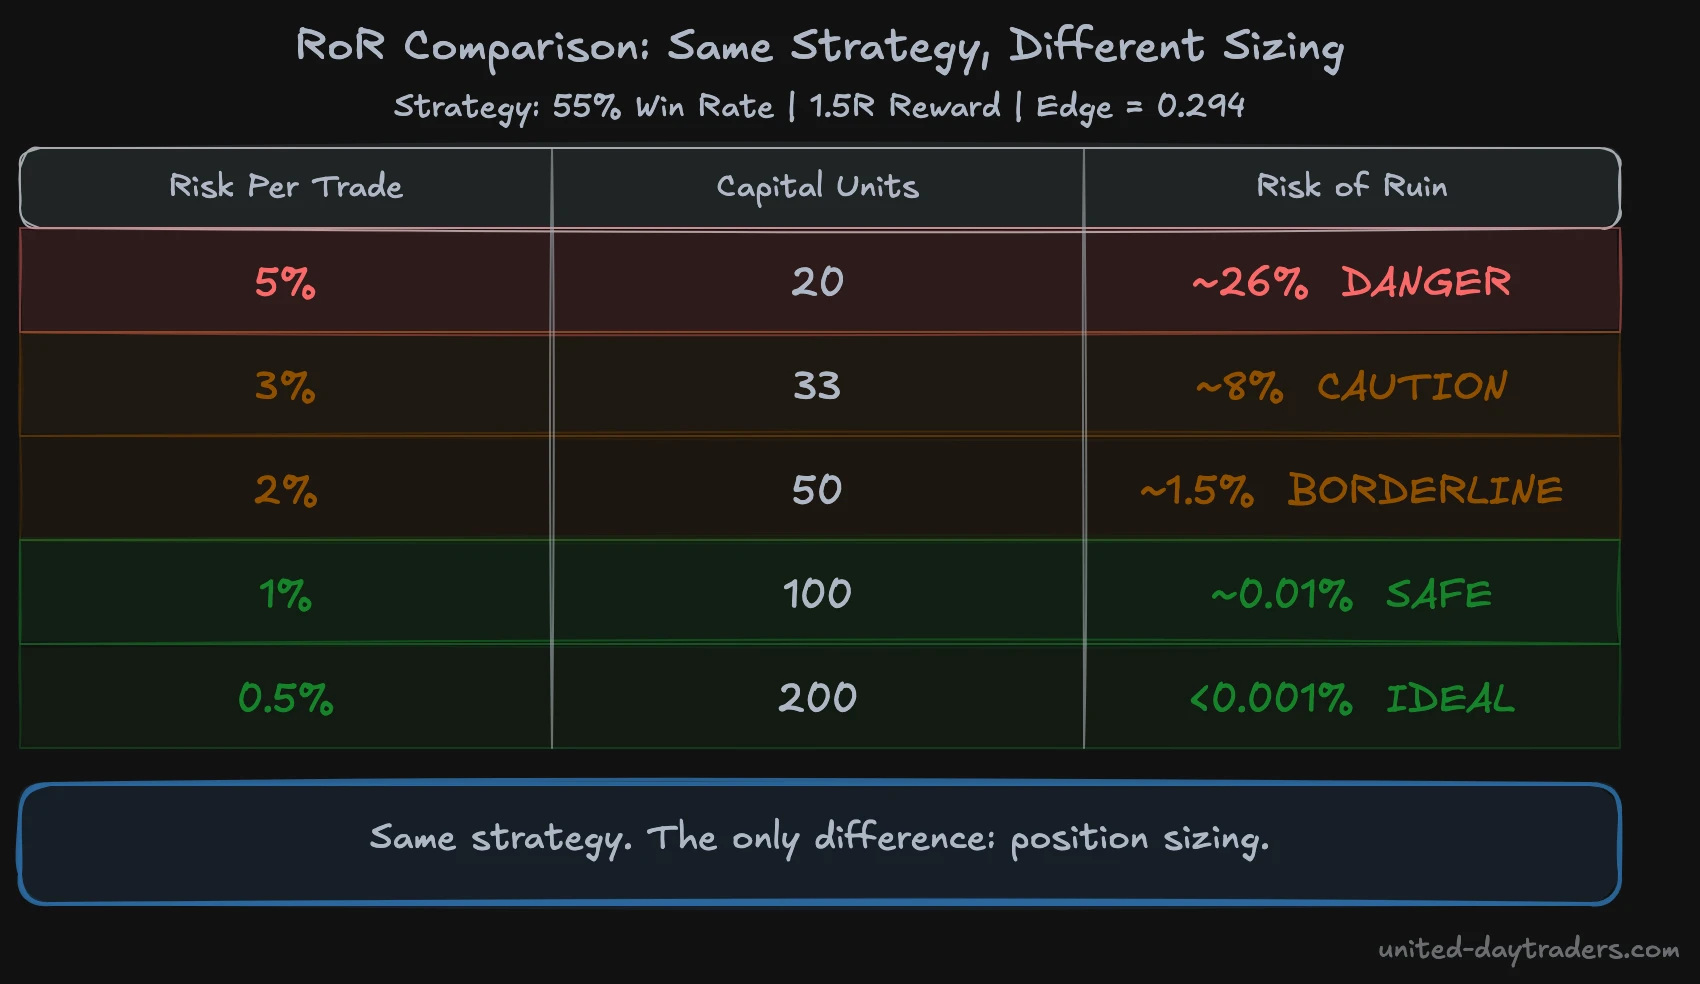
Same strategy throughout: 55% win rate, 1.5R reward ratio. Edge = 0.294.
Trader A: 5% Risk Per Trade
- Risk per trade: 5% of account
- Capital Units: 100 / 5 = 20 Units
RoR = ((1 − 0.294) / (1 + 0.294)) ^ 20
    = (0.5456) ^ 20
    ≈ 26%
Trader A faces a 26% risk of ruin with this strategy. One in four traders running this exact system at this exact sizing loses their account before the statistical edge has a chance to deliver profitable results.
Trader B: 1% Risk Per Trade
- Risk per trade: 1% of account
- Capital Units: 100 / 1 = 100 Units
RoR = ((1 − 0.294) / (1 + 0.294)) ^ 100
    = (0.5456) ^ 100
    ≈ 0.01%
Trader B faces a 0.01% risk of ruin with the same strategy — effectively zero.
What the Numbers Tell You
The only variable that changed: position sizing. Not the strategy. Not the win rate. Not the R-multiple. Solely the sizing.
This is a fundamental misunderstanding that costs many retail traders dearly: strategy and sizing solve two entirely different problems. The strategy determines your long-term profitability. The sizing determines your survival. You can have the most profitable strategy in the world — if your sizing ruins your account before the distribution kicks in, the strategy has no value.
Trader A and Trader B will produce identical results across 10,000 simulated trades — assuming both survive long enough to take them. Statistically, Trader A does not survive that journey in one out of every four attempts.
Risk of Ruin in Prop Firm Accounts
In prop firm accounts, the RoR calculation changes fundamentally — and not in your favor.
Standard RoR calculates survival until 100% capital loss. In a prop firm, you do not need to lose everything. You lose your account the moment you breach the maximum drawdown limit — typically 4–10% of the account.
Consider a typical prop firm setup: 8% maximum drawdown, 2% risk per trade.
- Capital Units until elimination threshold: 8 / 2 = 4 Units
- Edge = 0.294 (our example system)
RoR = (0.5456) ^ 4 ≈ 8.8%
With only four capital units before elimination, even a good system carries nearly a 9% risk of ruin in a single prop challenge attempt. This is precisely why institutional trading desks impose internal risk limits that keep effective capital units per trader very high — they want their desk-level risk of ruin to approach zero.
If you are preparing for a prop firm challenge, this article is directly relevant: How to Pass a Prop Trading Challenge
Calculating Your Own Risk of Ruin
A step-by-step guide:
Step 1: Determine your win rate from at least 50 live trades. Hypothetical or backtesting data systematically overstates win rates.
Step 2: Calculate your average R-multiple (Avg Win in R / Avg Loss in R). For 1:1.5 trades, RR = 1.5.
Step 3: Calculate your edge:
Edge = (WR × RR − LR) / (WR × RR + LR)
Step 4: Determine your capital units: Account size ÷ risk amount per trade. On a $10,000 account risking $100 per trade, that is 100 units.
Step 5: Calculate RoR:
RoR = ((1 − Edge) / (1 + Edge)) ^ Capital Units
Step 6: Interpret the result. Target: RoR below 1%. Ideal: below 0.1%. Anything above 5% is a serious structural problem — one you solve through sizing adjustment, not strategy optimization.
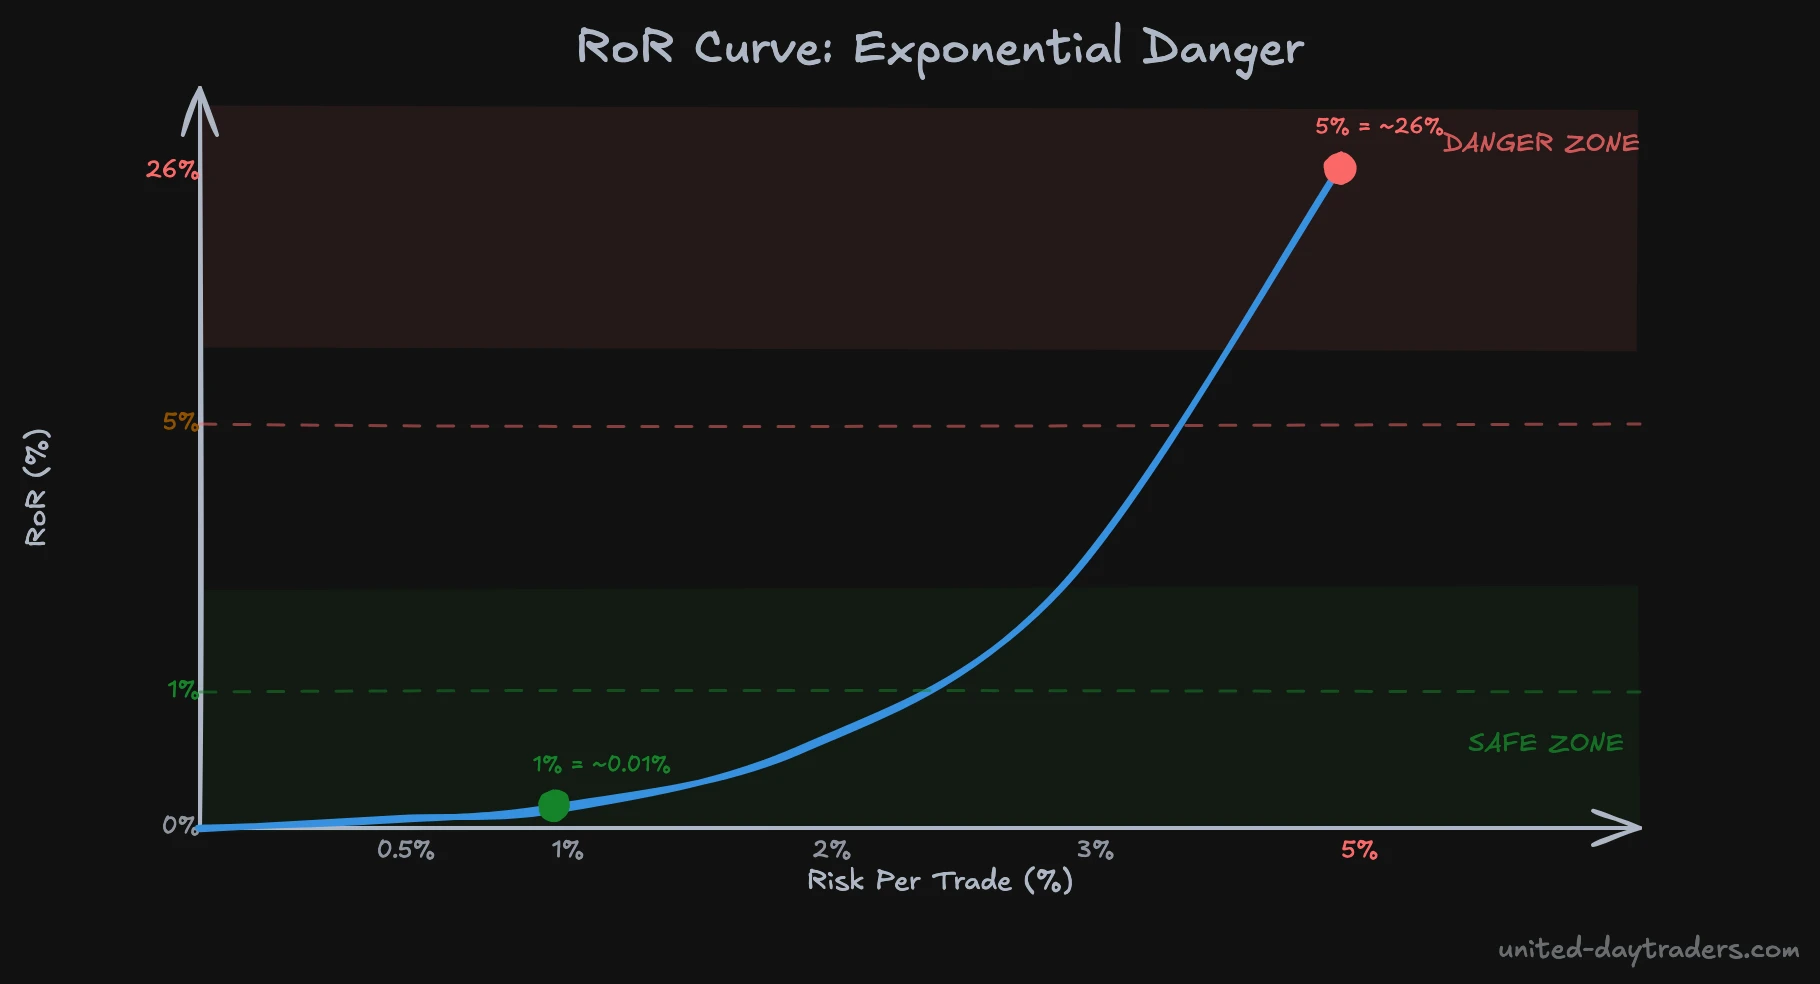
The curve reveals the core danger: the rise in ruin probability is not linear — it is exponential. Moving from 2% to 5% risk per trade is not a step on a staircase. It is a leap off a cliff.
For a comprehensive overview of the complete risk management framework, see: Risk Management in Trading
Frequently Asked Questions
Does risk of ruin only apply to day traders?
No. The formula applies to every trader regardless of timeframe. Swing traders and position traders often carry larger drawdowns between trades, which affects the capital units calculation, but the core formula is identical. A swing trader risking $500 per trade on a $50,000 account has 100 capital units — the same as a day trader risking $100 on a $10,000 account.
What is an acceptable risk of ruin level?
Institutional desks target below 0.1%. As a retail trader, you should treat 1% as your ceiling. Anything above 5% means your sizing has a serious structural flaw, regardless of how strong your strategy appears. The math does not lie: at 5% RoR, you statistically blow your account in one out of every twenty attempts before your edge gets to work.
Can a higher win rate compensate for aggressive sizing?
Partially. With a 70% win rate and 1:1 reward, you can size more aggressively because your edge value is higher. But most traders chronically overestimate their live win rate — especially in hindsight. The safer approach: use conservative sizing that survives even with a win rate that is 10–15% worse than your estimate. Calculate with your pessimistic win rate, not your optimistic one.
The traMADA mentoring program covers risk management and position sizing across 1,500+ video lessons with real NQ examples. Visit united-daytraders.com for the complete Nasdaq orderflow program.