Session High-Low Trading: Using Daily Extremes as Trading Signals
Session high and low are not random daily extremes — they are reference points where institutional traders evaluate their positions. A break above session high signals new buyers in the market. A failure at these levels signals weakness. Understanding this mechanics means reading the market like a professional.
Risk disclaimer: Trading futures and other financial instruments carries significant risk of loss. Past results are not indicative of future performance. Only risk capital you can afford to lose.
What Session High and Low Actually Mean
Session high and low are not simply "where price was." They represent the areas where the market accepted or rejected value during a specific session. Price revisiting these levels does not behave randomly — the market is testing whether the participants who created that extreme are still present.
When NQ reaches its daily high at 19,450 and reverses there, sellers were active at that price. Perhaps institutional desks were hedging against risk. Perhaps larger positions needed to partially close at that level. Those participants are still thinking about the 19,450 level the next day. They are watching whether the market returns to it, whether it breaks through, or whether it fails again.
That is the mechanism behind session levels: they are reference points for market participants with real positions. This distinguishes them from arbitrary support/resistance lines drawn on historical price movements.
The Initial Balance as the Day's Blueprint
The Initial Balance (IB) is the high-to-low range of the first trading hour (9:30–10:30 AM ET for NQ Futures). This range captures early institutional positioning and sets the framework for the entire trading day.
The IB acts as the day's blueprint:
- Once established, price either stays within the IB (range day) or breaks out (trend day)
- The direction of the first IB break often sets the day's bias
- IB extremes become the primary reference levels for the entire session
In practice, you mark the IB like this: at 10:30 AM ET, draw horizontal lines at the IB high and IB low. These lines stay on your chart all day. Everything that happens afterward is evaluated relative to these two levels.
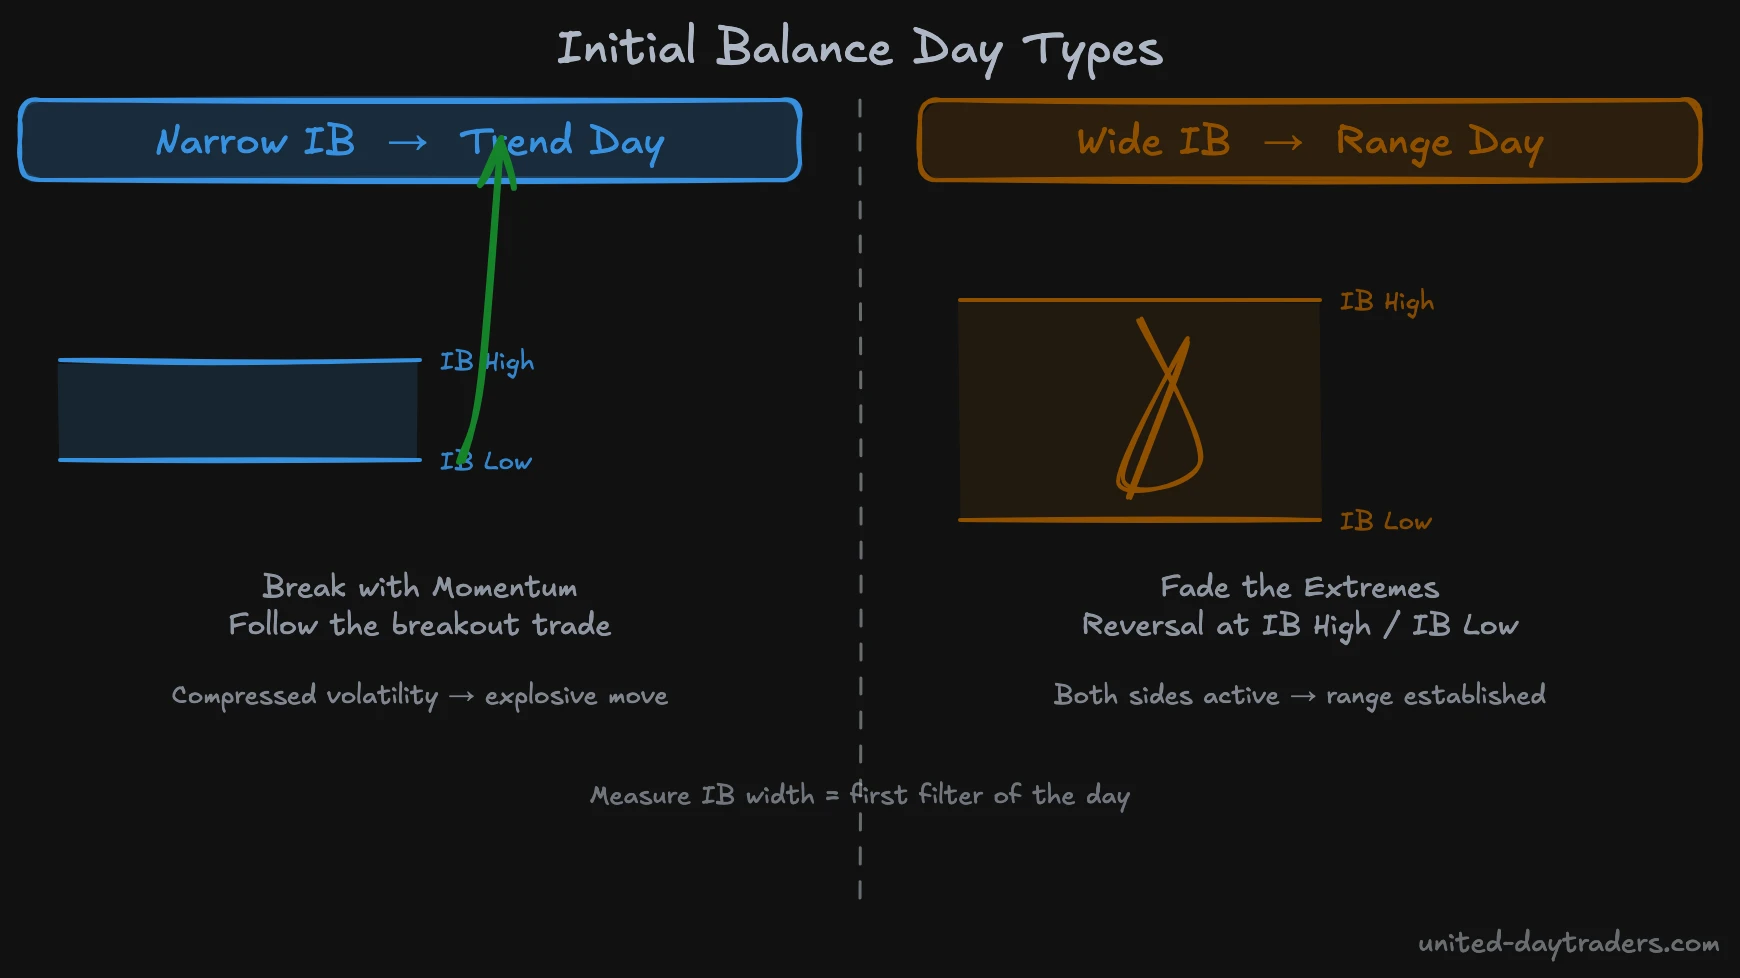
IB Width as a Regime Indicator
IB width is your first and most important filter in the morning. Before you look at any other indicator, measure the IB:
Narrow IB (NQ: below ~30–40 points): The market has not found direction in the first hour. Buyers and sellers are balanced. Narrow IBs invite explosive breakouts — when the market finally moves, it has pent-up energy. This is the classic trend day setup. Narrow IB means: be ready for the breakout, follow the first real move with volume.
Wide IB (NQ: above ~60–80 points): Both sides were already active in the first hour. Buyers and sellers have traded with conviction. Wide IBs tend to contain price for the remainder of the session — the market has already established its range. This is the classic range day setup: fade the extremes, trade reversals at IB high and IB low.
This is the professional's first filter in the morning: narrow IB = breakout readiness, wide IB = fade strategy. This single observation shapes your entire trading day.
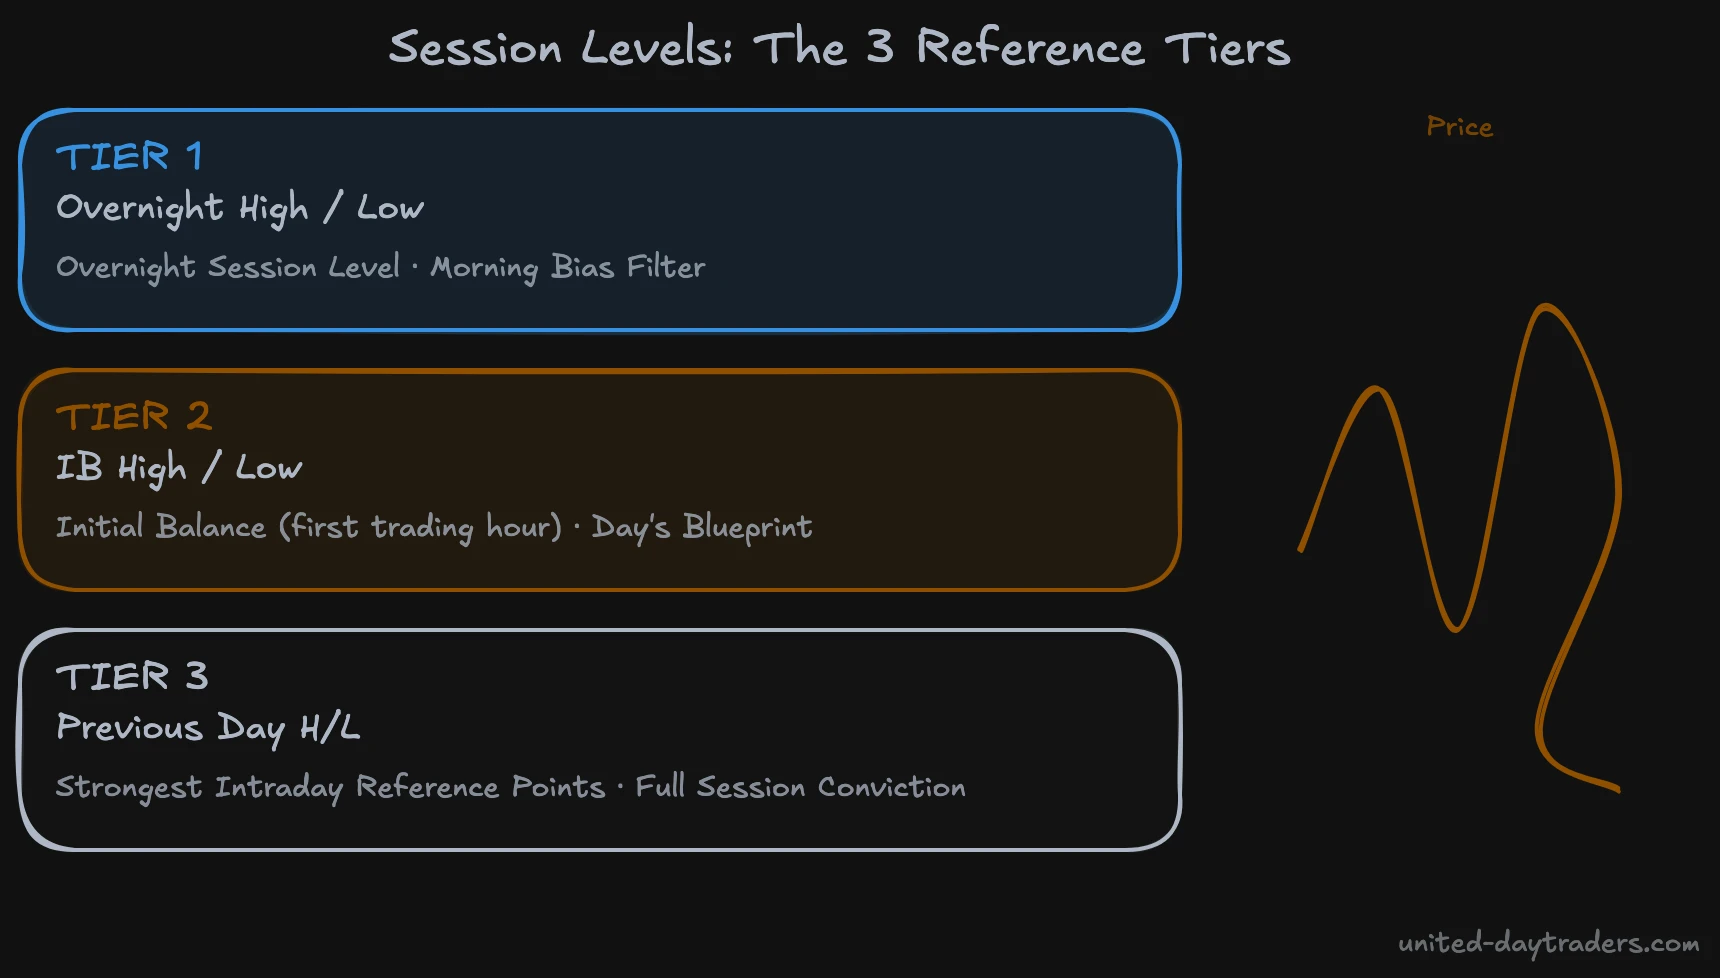
The Three Tiers of Session Reference Levels
Session levels form a hierarchy. Not all levels carry equal weight. Understanding these three tiers gives you an immediate structured approach to every trading day.
Overnight High and Low
The overnight session (when CME Globex is running but the US cash market is closed) creates its own high and low. These levels are more significant than most retail traders recognize.
Why they matter: A large percentage of NQ price action happens in the overnight session. Institutional desks in Asia and Europe trade NQ futures, hedge risk, and react to macro events. The overnight high and low are the result of genuine institutional activity.
The opening scenario at the US cash open therefore becomes clear:
- Opening above overnight high: bullish bias (buyers had the overnight session, no selling pressure)
- Opening below overnight low: bearish bias
- Opening inside overnight range: wait for directional confirmation
The first question at the US open is not "what does the RSI say?" — it is: "are we above or below the overnight range?" This single observation filters your morning bias.
Previous Day High and Low
Previous day high and low are the strongest intraday reference levels because they represent a full session's worth of conviction. These levels have:
- High liquidity clusters from yesterday's participants
- Stop orders sitting just beyond them (from traders who held overnight positions)
- Institutional interest when retested (desks that traded yesterday evaluate positions relative to these levels)
The playbook for PDH/PDL:
- Break above PDH with volume = continuation up, old resistance becomes support
- Rejection at PDH = distribution zone, potential reversal
- Break below PDL = momentum down, previous support now resistance
- Bounce at PDL = potential reversal, watch for volume confirmation
The PDH is especially important on days where the market has been consolidating and then breaks out. A break above the previous day high with elevated volume is one of the clearest breakout signals in intraday trading.
Settlement Price as a Complement
The settlement price (CME's official close, volume-weighted over the last 30 seconds of the session) is often tested during the European session before the US open. When price is at or near settlement at the cash open, it signals equilibrium — no strong bias. When it deviates far from settlement, expect magnetic pull back to that level.
For more on practical applications of the settlement price, see the article on settlement price trading.
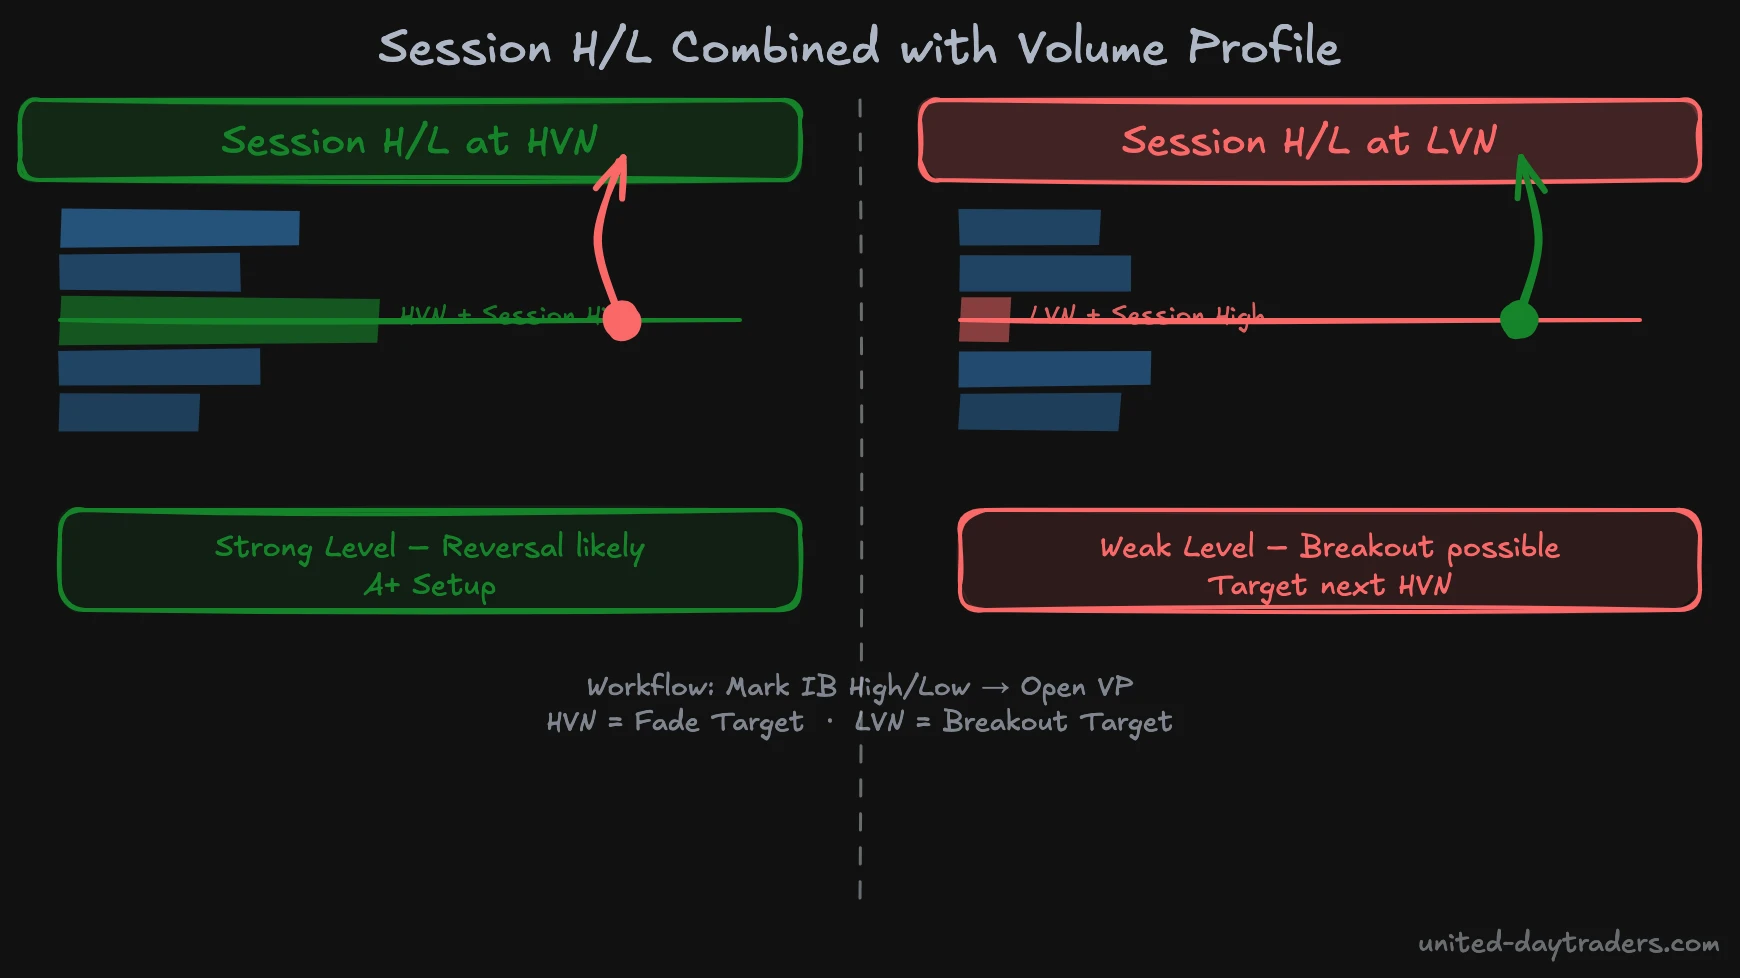
Session Levels Combined with Volume Profile
This is where session H/L analysis becomes institutional grade. Not all session levels are equal. A session high that forms at a High Volume Node (HVN) on the Volume Profile is structurally different from one that forms at a Low Volume Node (LVN).
Session H/L at HVN (strong level):
- HVN means lots of business was done here, many participants hold positions
- When price revisits an HVN that coincides with a session extreme, the level has deep structural support
- Reversals from these levels tend to be sharp and sustained
- These are your A+ setups
Session H/L at LVN (weaker level, potential gap fill):
- LVN means thin volume, the market moved through quickly
- Session extremes at LVNs are "air pockets" — price can gap through them
- Do not treat these as hard support/resistance
- If price breaks through an LVN session high, it tends to move to the next HVN quickly
The practical workflow: mark your IB high/low, then pull up the daily volume profile. If the IB high sits at an HVN, it is a strong fade target. If it sits at an LVN, consider a breakout trade toward the next HVN.
This combination of session level and Volume Profile is the difference between retail trading and an institutional approach. More on the underlying framework in the article on Auction Market Theory and trading.
Common Mistakes in Session H/L Trading
1. Treating session high/low as an absolute stop point: Stops placed directly at session levels are systematically hunted. Market makers know where liquidity clusters — it is just beyond the most obvious levels. Place stops above/below the level with a buffer of 5–10 NQ points, never directly at the level itself.
2. Ignoring IB width: A session high break on a wide IB is often not a genuine signal — the market is already extended, and the statistical probability of a range day is high. Only on a narrow IB does the breakout carry statistical weight. Trading without awareness of IB regime means operating in the wrong context.
3. Not marking overnight levels: Many traders begin their analysis at the US open at 9:30 AM ET. This means ignoring the overnight session H/L, which are often the most important levels of the day. The overnight range must be marked on the chart before the US open.
4. Not adding Volume Profile: Session levels without VP context are operating at half-vision. An H/L at an LVN looks identical to one at an HVN on a plain price chart, but behaves completely differently. The Volume Profile is not an optional add-on — it is the decisive quality filter.
For a deeper look at identifying market phases that provide context for session levels, see the article on recognizing market phases.
FAQ: Common Questions About Session High and Low
How long do session high and low remain valid as reference points?
Previous day session H/L remain strong levels for the entire next trading day. After 2–3 days they lose relevance as more of the original positions are closed. Overnight levels are primarily valid for the same day's US cash session. IB levels lose significance after the trading day ends and are replaced by the next day's IB.
What happens when the market breaks through a session level very quickly?
Fast breaks with high volume are usually genuine breakouts — the volume confirms that aggressive buyers or sellers have overwhelmed the level. Fast breaks with low volume, especially overnight or in thin markets, are frequently false breakouts: price briefly pierces the level, triggers stops, then reverses. Volume is the decisive confirmation — always test whether the level holds on the first retest.
How is session H/L trading different from standard support/resistance?
Session H/L are time-defined levels with clear institutional context: margin calls, position evaluation, stop clusters from overnight positions. Standard support/resistance is price-level-based and describes historical turning areas without an explanatory mechanism. Session H/L produce more predictable reactions because more institutional participants are actively watching these specific levels and making trading decisions relative to them.
The traMADA NQ Masterclass covers session high-low analysis across 1,500+ video lessons with real chart examples. Visit united-daytraders.com for the complete Nasdaq orderflow program.