Multi-Timeframe Analysis: From the Big Picture to Precise Entries
Multi-timeframe analysis is the systematic process of reading multiple timeframes to establish directional bias on a higher chart and execute entries on a lower one. Without this two-step approach, you are trading blind. Your 5-minute chart without daily context is a paragraph ripped from a book with no chapter heading.
Risk Disclaimer: Trading futures and other financial instruments involves significant risk of loss. Past results are not indicative of future performance. Only trade with capital you can afford to lose.
Why a Single Timeframe Will Fail You
Most traders start their day by opening a 5-minute chart and immediately hunting for setups. That is the fastest way to lose money. Your 5-minute chart shows microstructure: small pullbacks, short-term ranges, individual candle patterns. What it does not show you is the bigger picture.
Imagine you see a clean pullback to VWAP on the 5-minute chart. Everything looks bullish. You go long. The trade runs 10 points your way, then reverses hard. What happened? On the daily, price just failed at a massive resistance level. The 4-hour candle printed a long upper wick. The market moved below the prior day's value area. Your 5-minute setup was technically correct but strategically worthless.
This is why multi-timeframe analysis is not optional. It is the foundation of every trade decision. In order flow trading, we confirm entries with absorption and delta. But even the cleanest order flow signal on the 1-minute chart will fail when the higher timeframe says otherwise.
The Three-Level Framework
I work with three distinct timeframe levels. Each has a specific job, and none can replace the others.
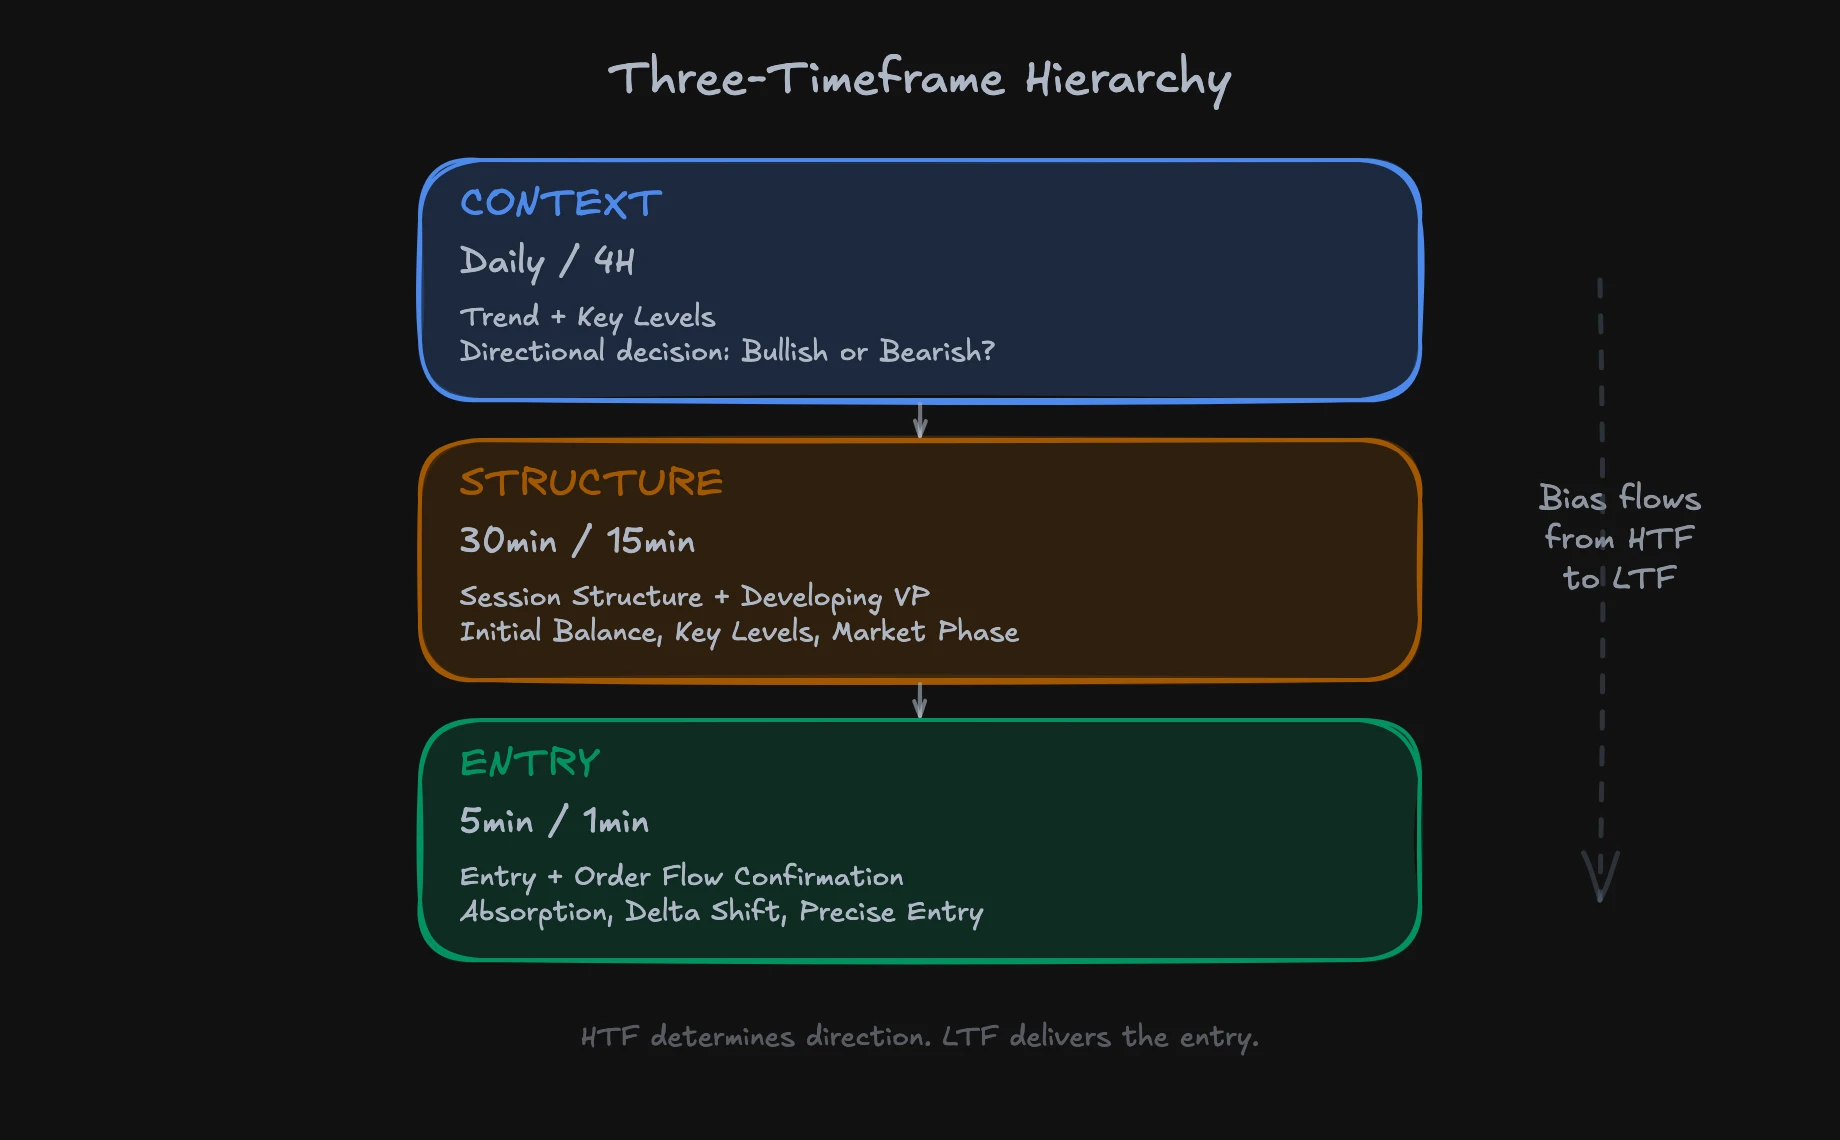
Level 1: Daily and 4H (Context)
The daily and 4-hour charts provide directional bias. Here you answer one question: Am I bullish or bearish today?
I look at three things:
- Price vs. Daily Value Area: Is the market trading inside, above, or below yesterday's value area? Inside means rotation. Outside means directional movement. The Volume Profile shows this instantly.
- Price vs. VWAP: Is price above or below VWAP? The VWAP direction gives you the bias of institutional average pricing.
- Position within Value Area: Is price at the upper or lower end? This defines whether the current price is expensive or cheap.
These three data points combine into a clear directional decision. Daily bearish means: I am looking exclusively for short setups today. Period.
Level 2: 30min and 15min (Structure)
The middle level shows you the current session structure. This is where you see how today's price action develops within the HTF context.
What I watch on this level:
- Initial Balance: The range of the first 30 to 60 minutes defines the session type. Narrow = potential trend day. Wide = likely rotation. This concept ties directly into identifying market phases.
- Developing Volume Profile: Where is volume building? Is a D-shape forming (range) or a P/b-shape (trend)?
- Key Levels: Where are the supply and demand zones on the 15-minute chart? These zones become your entry candidates.
The structure level confirms or contradicts the HTF bias. If the daily is bearish but the 30-minute structure shows strong buying absorption at the day's low, I wait. The conflict needs to resolve first.
Level 3: 5min and 1min (Entry)
Only here does the actual trade happen. On the 5-minute and 1-minute charts, you find the precise entry point in the direction of the HTF bias.
What makes a good LTF entry:
- Pullback to a key level: Price pulls back to a zone you identified on the structure level.
- Absorption: Aggressive sellers hit passive buyers (or vice versa). In the delta and CVD, you see this as a divergence between price and cumulative delta.
- Delta shift: After absorption, delta flips in your direction. That is the confirmation.
The LTF entry is a timing tool, not standalone analysis. Without the HTF context and structure read, the LTF entry has no edge.
Reading HTF Context: The Checklist
Before I take my first trade each morning, I run through a systematic checklist. It takes five minutes and saves me hours of losing trades.
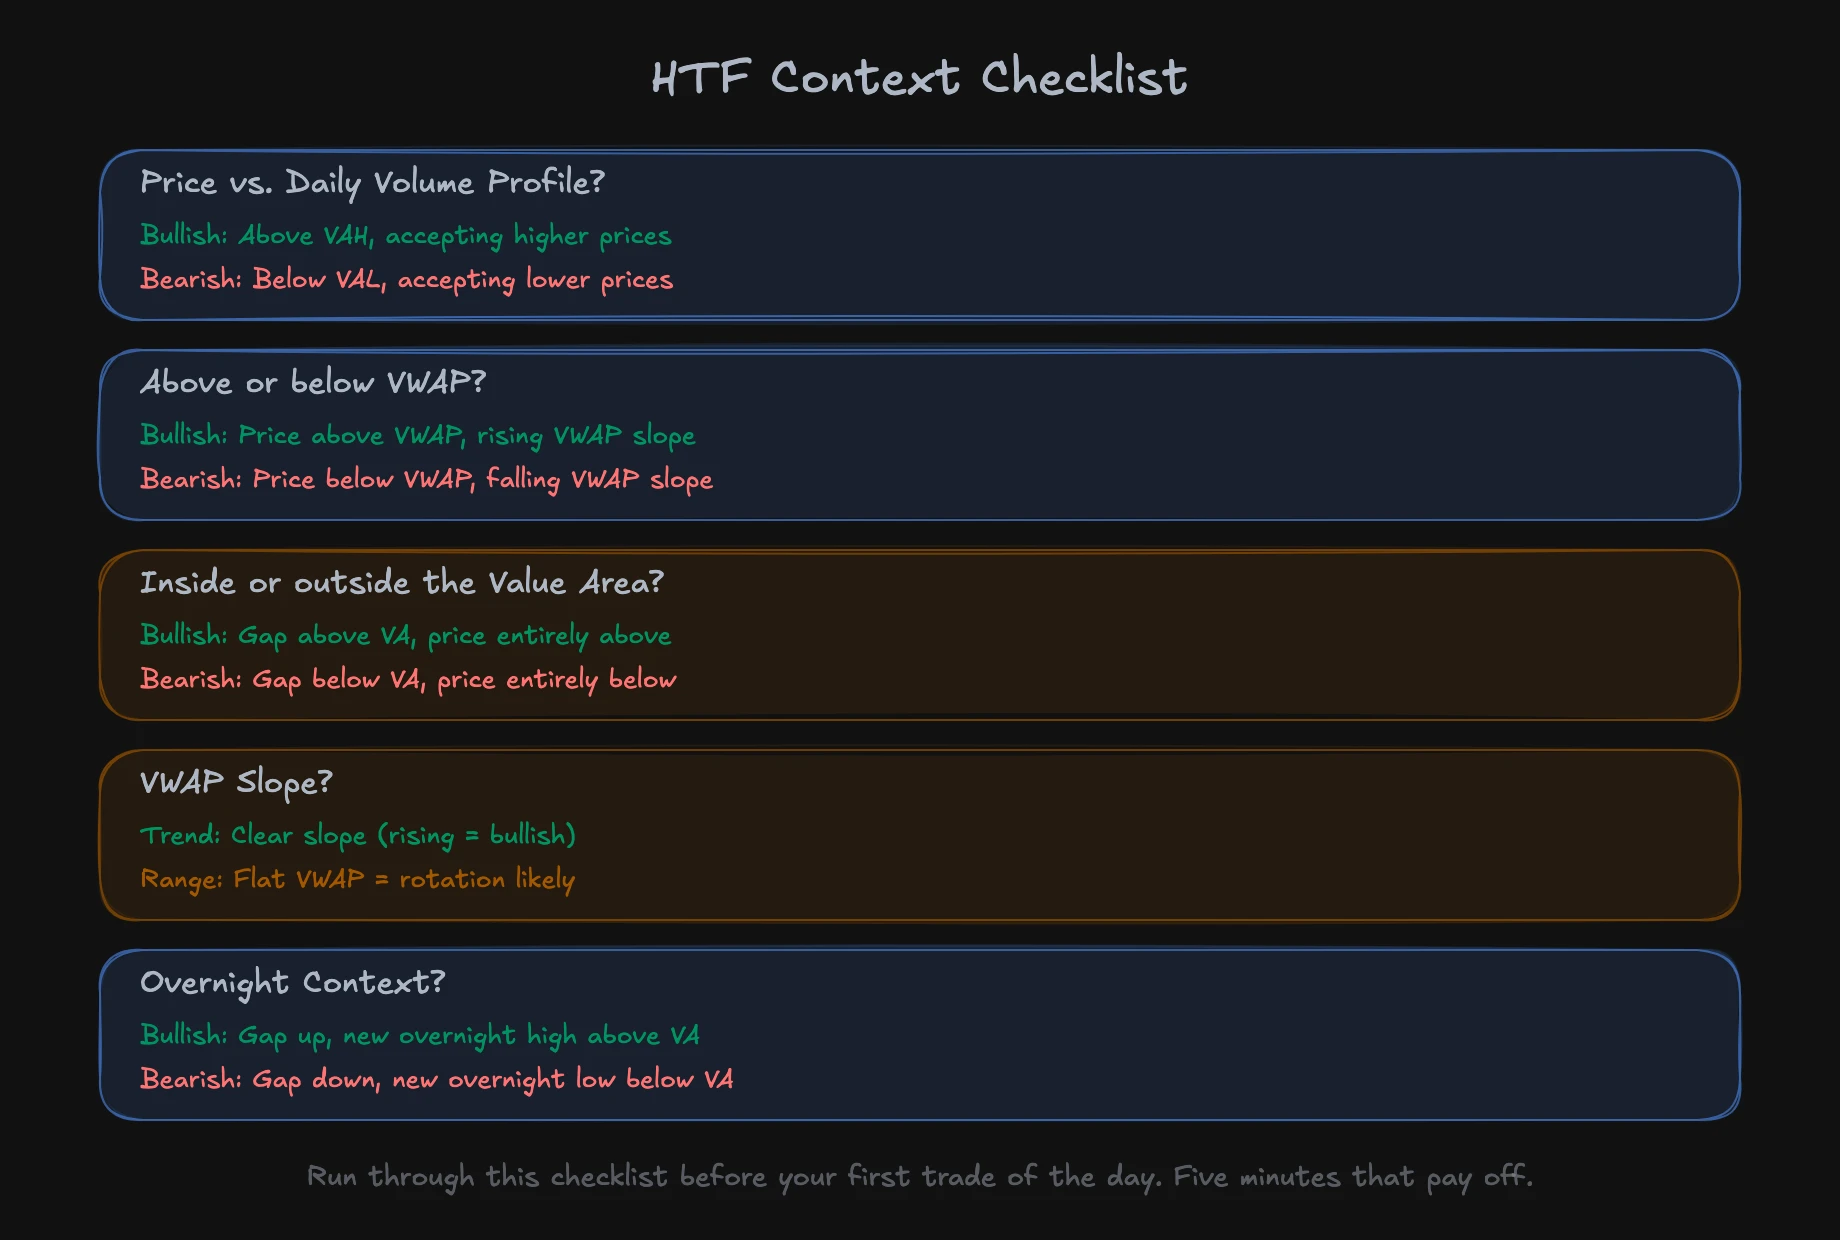
Price vs. Daily Volume Profile: Where is price relative to yesterday's volume profile? Above VAH, it is expensive for buyers. Below VAL, it is cheap. Inside the value area, it is neutral. In Auction Market Theory, we call this acceptance (inside) vs. price discovery (outside).
VWAP Analysis: VWAP shows you the volume-weighted average price. Price above it means buyers are in control. Below it means sellers dominate. The slope matters most: a rising VWAP confirms bullish bias, a falling VWAP confirms bearish.
Value Area Relation: Is today's price inside or outside yesterday's value area? A gap above (completely over the VA) is strongly bullish. A gap below is strongly bearish. Overlap suggests rotation.
Overnight Context: What happened during Asia and Europe sessions? Did price set a new high or low? Overnight levels often become the first reaction zones in the US session.
VWAP Slope: A flat VWAP means range. A clear slope means trend. One of the simplest yet most effective indicators for the day's direction.
When Timeframes Conflict
This is the single most important rule in multi-timeframe analysis, and most traders ignore it: When timeframes conflict, the higher timeframe always wins.
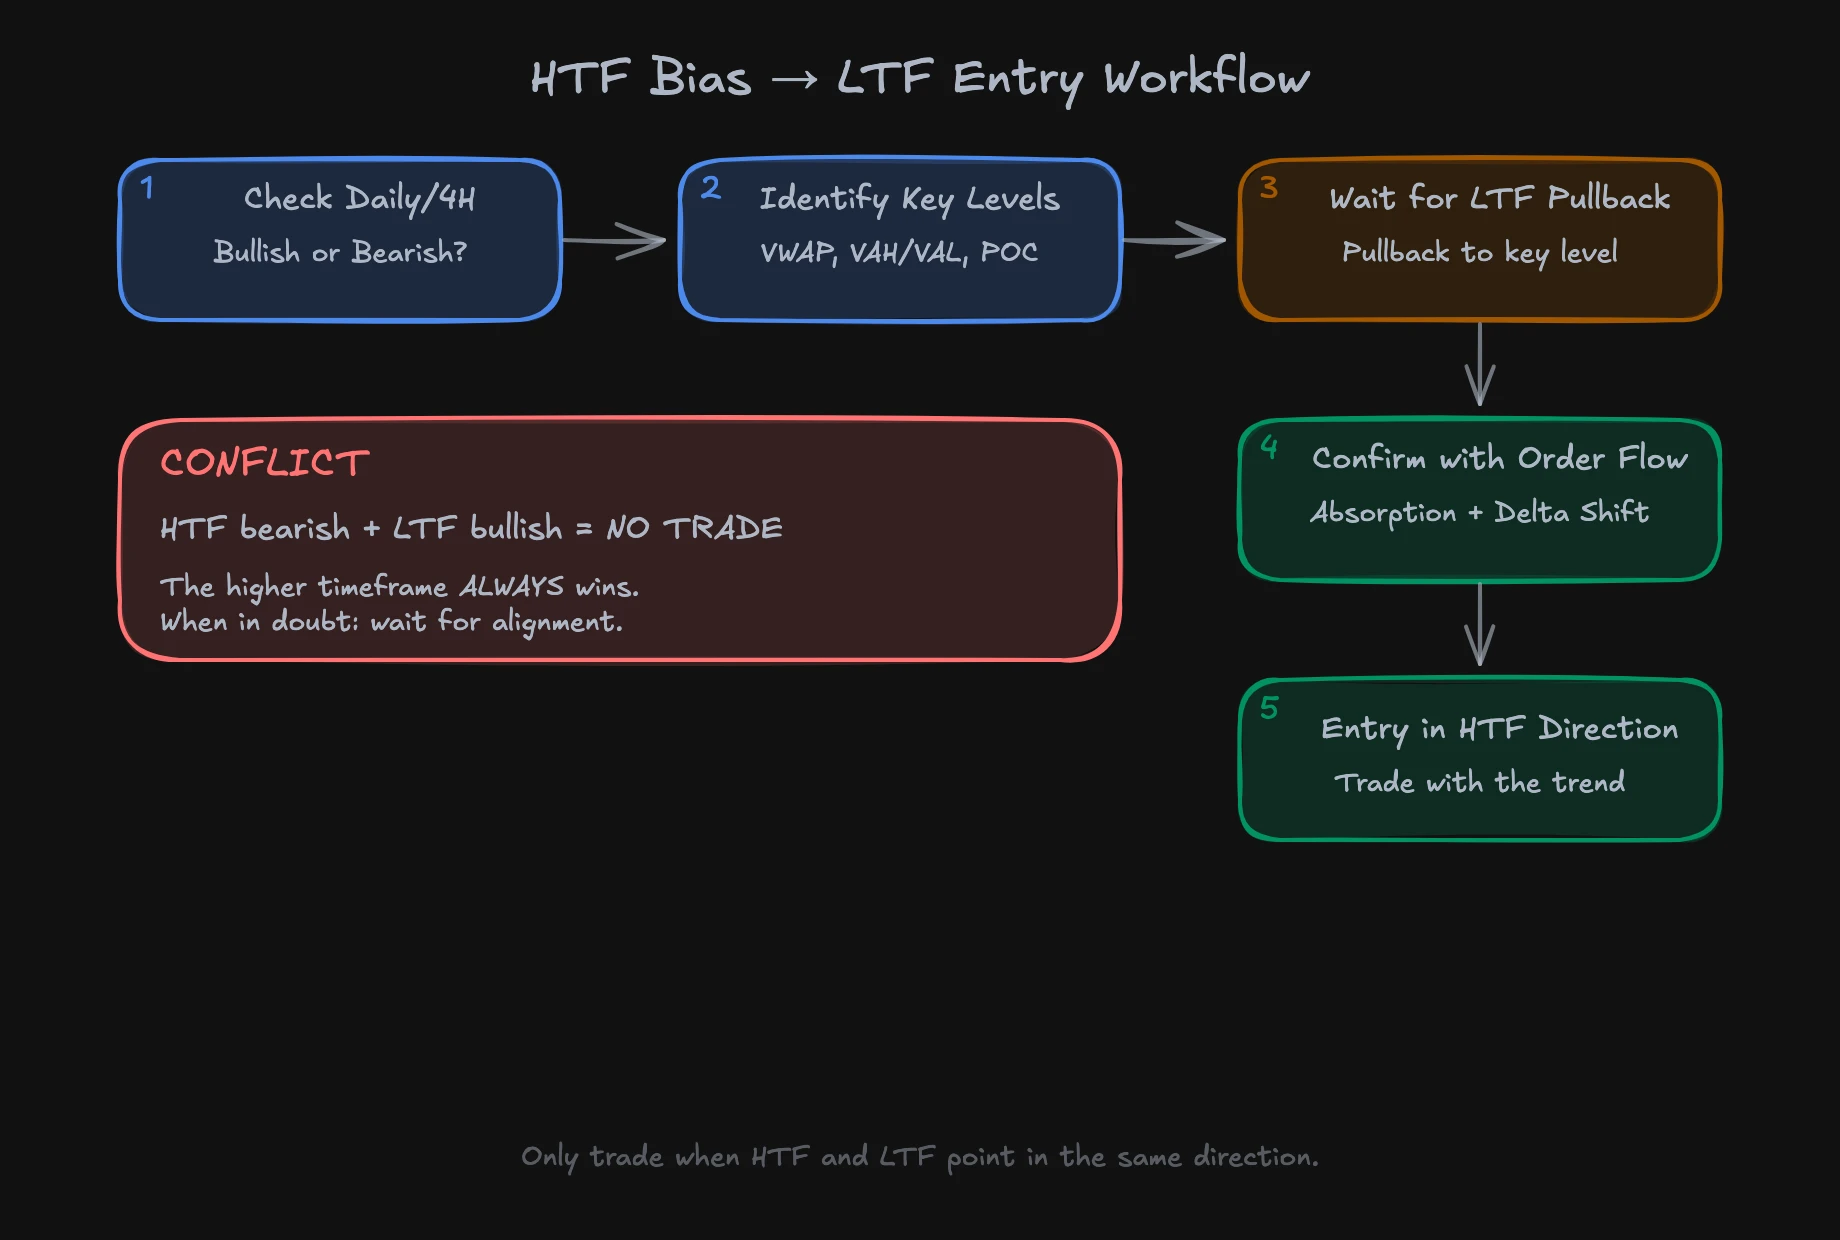
Daily bearish plus 5-minute bullish does not equal a long trade. The 5-minute chart is showing you a short-term bounce within a larger downtrend. If you take that long, you are trading against the institutions. And they have more capital than you do.
I have seen this pattern destroy accounts over and over: a trader spots a perfect setup on the small chart and takes it, even though the big chart is screaming the opposite direction. The outcome is predictable. The trade works briefly, reverses, and the trader is stuck in a loss that should never have existed.
My rule: if the timeframes do not align, I do not trade. There are enough setups every day. I do not need to trade the conflicts. In Nasdaq futures trading, especially around OPEX days (options expiration), conflicting signals between timeframes are common because gamma exposure distorts short-term moves.
A Practical Example: The Two-Step in NQ
A typical morning looks like this for me:
- 8:30 AM (pre-open): Check the daily and 4H charts. NQ opened overnight below yesterday's VAL. VWAP is sloping down. Bias: bearish.
- 9:30 AM (US open): Watch the 30-minute chart. The initial balance is narrow (60 points). The developing volume profile shows a b-shape. Confirmation: trend day to the downside is likely.
- 10:00 AM: 5-minute chart. Price pulls back to VWAP. On the 1-minute chart, I see absorption: aggressive buyers are being absorbed by passive sellers. Delta flips negative. Entry: short at VWAP.
Three levels, one decision. The HTF provides direction, the structure confirms the market type, and the LTF delivers the entry.
FAQ
What are the best timeframes for multi-timeframe analysis?
For intraday NQ trading, I use daily/4H for context, 30min/15min for session structure, and 5min/1min for entries. This combination covers all relevant perspectives without overwhelming you with charts. The exact timeframe pairing matters less than having enough separation between levels so each one offers a distinct perspective.
How do I handle conflicting signals between timeframes?
Simple: the higher timeframe always wins. If your daily is bearish and your 5-minute chart looks bullish, you do not take a long. The short-term bounce will likely fail because the larger directional force is working against it. When in doubt, sit on your hands and wait for alignment across timeframes.
How much time does the daily multi-timeframe analysis take?
The morning HTF analysis takes five to ten minutes. You check the daily chart, overnight behavior, and current position within the volume profile. From there, the analysis runs live: you observe the structure level during the first 30 minutes of the session, and the LTF entry develops in real time. It is not a separate step but an integrated thinking process that becomes second nature with practice.
In our mentoring program, you learn these concepts across 1,500+ video lessons with real chart examples. The NQ Masterclass includes dedicated modules for higher-timeframe and lower-timeframe analysis with hands-on exercises. Learn more at uniteddaytraders.com.