Market Internals Trading: How TICK, ADD and VOLD Give You the Edge
Market internals trading is the practice of reading aggregate stock-level data to gauge whether the broad market supports or contradicts your directional thesis. Instead of watching a single chart in isolation, you monitor how many stocks are ticking up vs. down, how many are advancing vs. declining, and where volume is flowing. These are the vital signs of the market, and ignoring them is like a doctor checking only one symptom.
Risk Disclaimer: Trading futures and other financial instruments involves significant risk of loss. Past results are not indicative of future performance. Only trade with capital you can afford to lose.
When I first started trading NQ full-time, I made the same mistake most retail traders make: I stared at the NQ chart, maybe glanced at ES for "correlation," and that was it. My win rate was mediocre. The turning point came when a senior trader at the prop desk told me, "You're trading the thermometer, not the patient." He pulled up three sub-charts below his NQ window: TICK, ADD, and VOLD. Within a week, my read on the market changed fundamentally. Not because these indicators gave me signals, but because they gave me context.
In this guide, I'll break down the three core market internals every day trader should monitor, show you exactly how they confirm or contradict your NQ thesis, and explain the divergences that have saved me from some of my worst potential trades.
What Are Market Internals and Why Do They Matter?
Market internals measure the underlying health of the market by aggregating individual stock behavior across an entire exchange. A single index like the Nasdaq-100 can rally because three mega-cap stocks are carrying the weight while 90 others are flat or declining. The index chart won't show you that. Market internals will.
The Difference Between Price and Breadth
Price tells you what happened. Breadth tells you how many participants agreed with what happened.
Think of it this way: if NQ rallies 100 points and 400 of the NYSE stocks are advancing while only 100 are declining, that rally has broad participation. The move is healthy. But if NQ rallies 100 points and only 150 stocks are advancing while 350 are declining, that rally is being carried by a handful of names. It's fragile.
This distinction matters because fragile rallies fail. Not always immediately, but with high probability within that session. As a day trader, knowing whether a move has broad participation directly affects my position sizing, my target expectations, and whether I even take the trade at all.
Why Retail Traders Ignore Internals
Most retail day traders never look at market internals. The reason is simple: it's not flashy. There's no crossing signal, no color change, no alert. It requires interpretation, context, and experience. Indicator-based trading is easier to sell in courses and YouTube videos. "When the line crosses, buy" is a simpler pitch than "monitor aggregate advancing-declining data and assess breadth confirmation in real-time."
But the institutional world lives on breadth data. Portfolio managers at large funds don't ask "What did the S&P close at?" They ask "How was breadth today?" because breadth tells them whether the market's move was structural or cosmetic.
When to Check Internals
I check market internals at three specific moments:
- Before entering a trade to confirm that broad market participation supports my thesis
- During a trade to monitor whether the conditions that justified my entry are still intact
- At key decision points (approaching VWAP, prior day high/low, round numbers) to see if the market has the breadth to push through
This isn't something you glance at once and forget. It's an ongoing read, like monitoring vital signs during surgery.
The Big Three: TICK, ADD, and VOLD Explained
There are dozens of market breadth indicators. I use three. They cover everything I need to know about broad market participation, and they complement each other without redundancy.
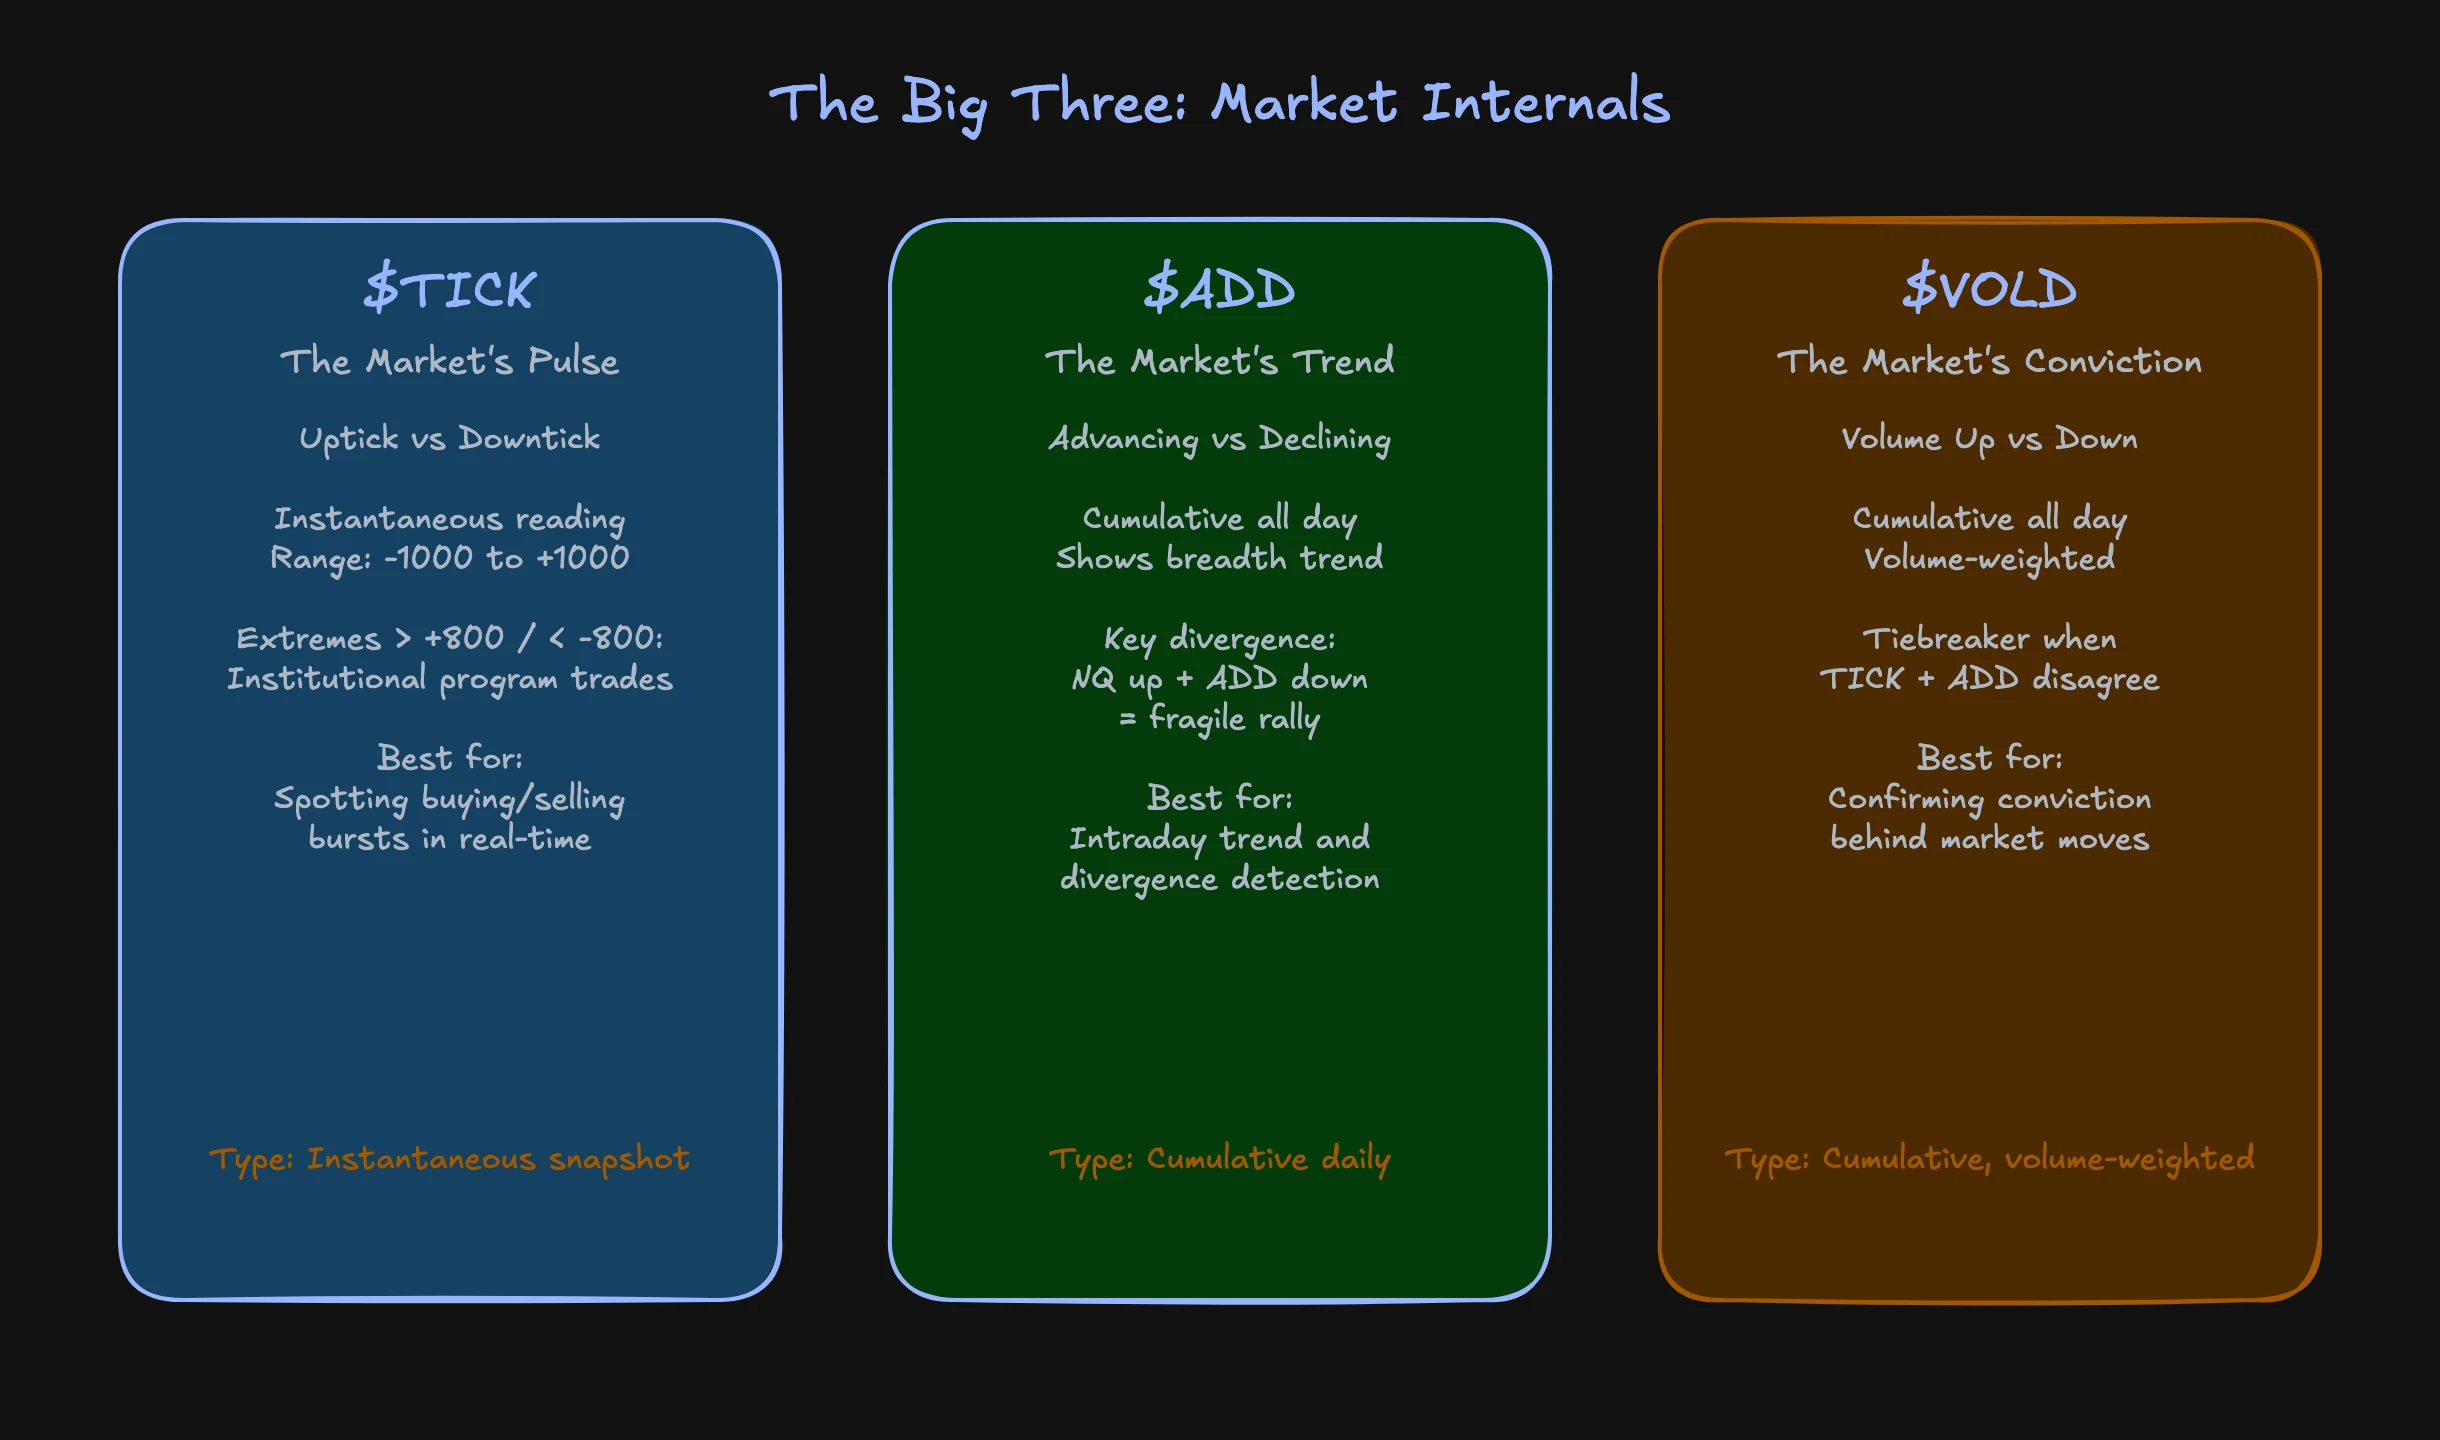
TICK Index: The Market's Pulse
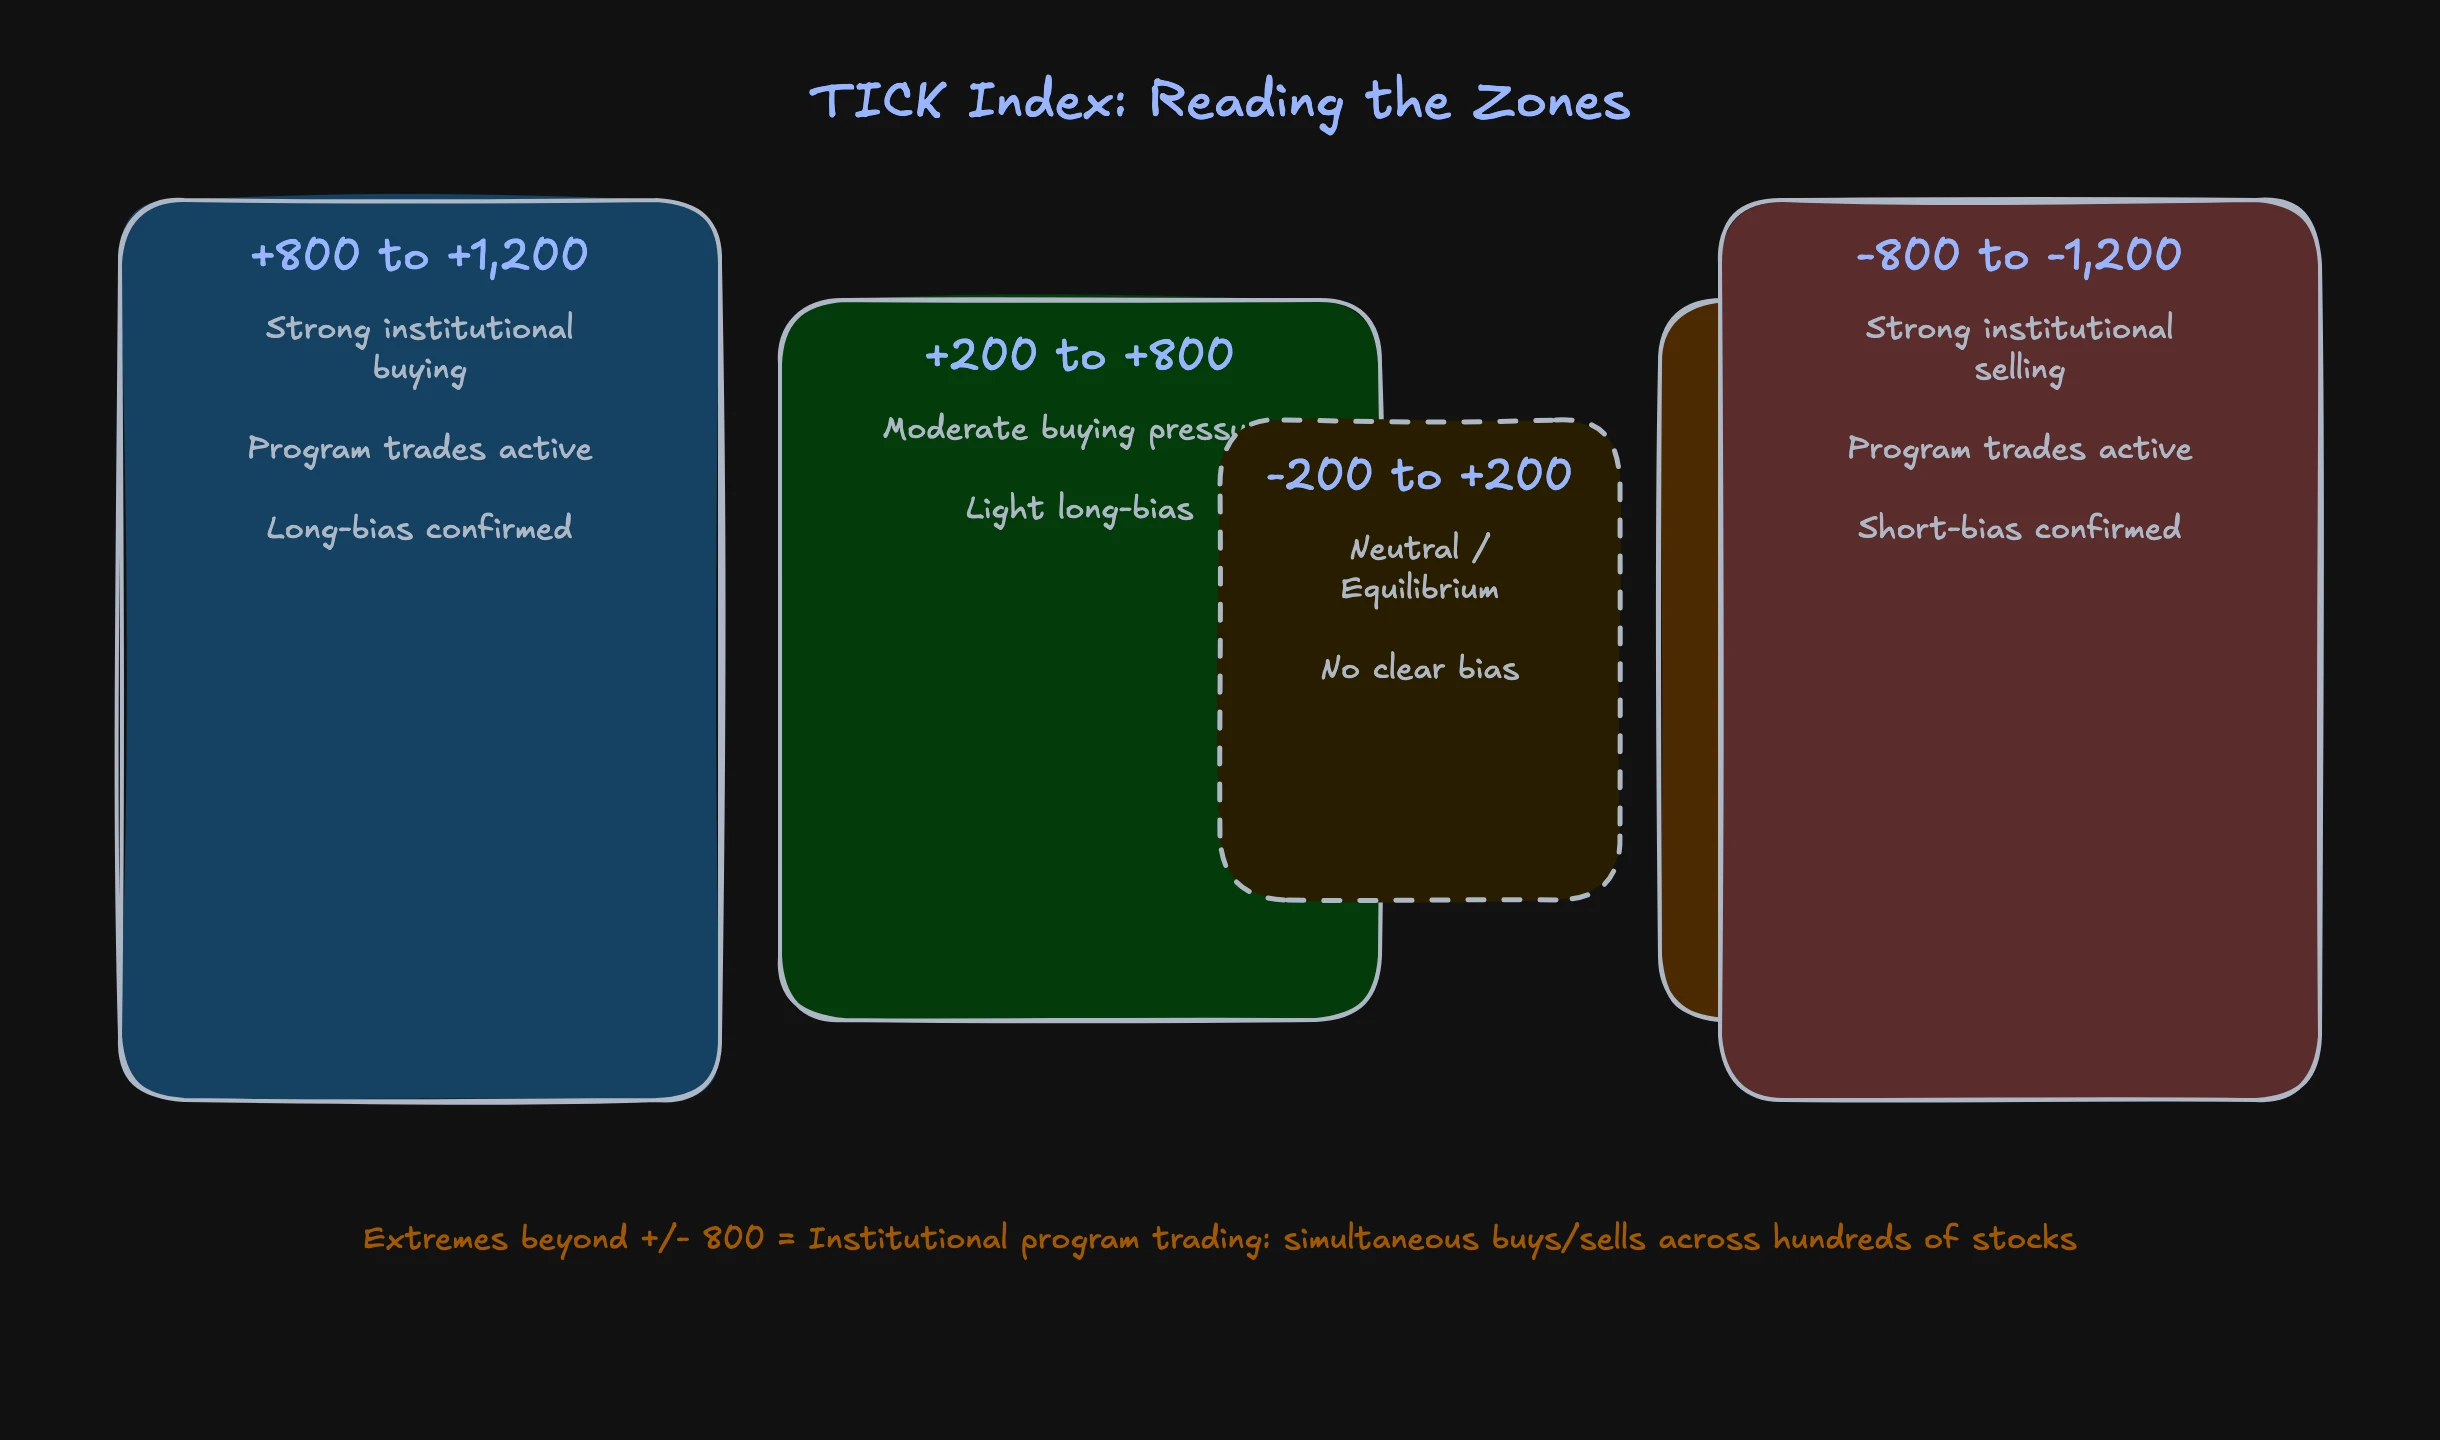
The NYSE TICK index counts how many NYSE-listed stocks last traded on an uptick vs. a downtick. The reading oscillates constantly, typically between -500 and +500 during normal conditions, with extremes pushing beyond +/-1,000.
Here's what the numbers mean:
- +500 to +800: Moderate buying pressure across the board
- +800 to +1,000: Strong buying, institutional programs likely active
- Above +1,000: Extreme buying, often program trading or MOC (Market on Close) imbalances
- -500 to -800: Moderate selling pressure
- -800 to -1,000: Strong selling, institutional programs likely active
- Below -1,000: Extreme selling, panic or forced liquidation
The key insight is not individual readings but the pattern. A series of TICK prints above +800 with very few prints below -300 tells me that institutions are aggressively buying across the board. That is different from a single spike to +1,000 followed by a drop back to zero. The sustained pattern matters more than any individual print.
When I see TICK consistently printing above +600 while NQ is pulling back to VWAP, that's a setup I pay attention to. The broad market is buying, but NQ is temporarily weak. Reversion is likely.
ADD (Advance-Decline Line): The Market's Trend
The NYSE Advance-Decline (ADD) line is the cumulative count of advancing stocks minus declining stocks throughout the session. Unlike TICK, which resets with every print, ADD builds throughout the day. It shows direction and momentum of broad participation.
ADD is my primary breadth tool. Here's why: TICK is noisy. It spikes and drops constantly. ADD smooths out the noise by accumulating the data. If ADD is trending upward from the open, even with occasional dips, the broad market is in a buying mode. If ADD is falling while NQ is rallying, I have a divergence, and that's one of the most valuable signals in day trading.
A practical example: On a typical trading day, NQ opens and rallies 80 points in the first 45 minutes. The chart looks bullish. But I look at ADD, and it peaked 20 minutes ago and has been declining since. That tells me the initial rally was broad-based, but participation has narrowed. The mega-caps are still pushing NQ higher, but the rest of the market is already selling. This is the setup for a pullback, and it plays out with remarkable consistency.
VOLD (Volume Advance-Decline): The Market's Conviction
VOLD measures the volume flowing into advancing stocks vs. declining stocks. While ADD counts the number of stocks, VOLD weights them by how much volume is behind each move. This is the conviction indicator.
Here's why VOLD matters: 200 stocks can advance, but if the volume behind those advances is tiny while 100 declining stocks have massive volume, the decline is the dominant force. VOLD captures this imbalance.
I use VOLD primarily as a filter. When both ADD and VOLD confirm a direction, my conviction is high. When ADD says "advancing" but VOLD says "volume favors decliners," something is off, and I reduce my size or skip the trade entirely.
Comparison Table: TICK vs. ADD vs. VOLD
| Feature | TICK | ADD | VOLD |
|---|---|---|---|
| What it measures | Uptick vs. downtick count | Advancing vs. declining stocks | Volume in advancing vs. declining |
| Timeframe | Instantaneous (resets each print) | Cumulative (builds all day) | Cumulative (builds all day) |
| Best for | Spotting institutional bursts | Identifying intraday trend | Gauging conviction behind moves |
| Signal type | Extreme readings (>+/-800) | Trend direction and divergences | Confirms or denies ADD signals |
| Noise level | High (oscillates fast) | Medium (smoothed) | Low (weighted by volume) |
| Data source | NYSE | NYSE | NYSE |
Using Market Internals for NQ Day Trading
NQ doesn't trade in isolation. It's a derivative of the Nasdaq-100 index, which itself is a subset of the broader stock market. When you trade NQ without checking internals, you're flying blind. Here's how I integrate the Big Three into my NQ trading process.
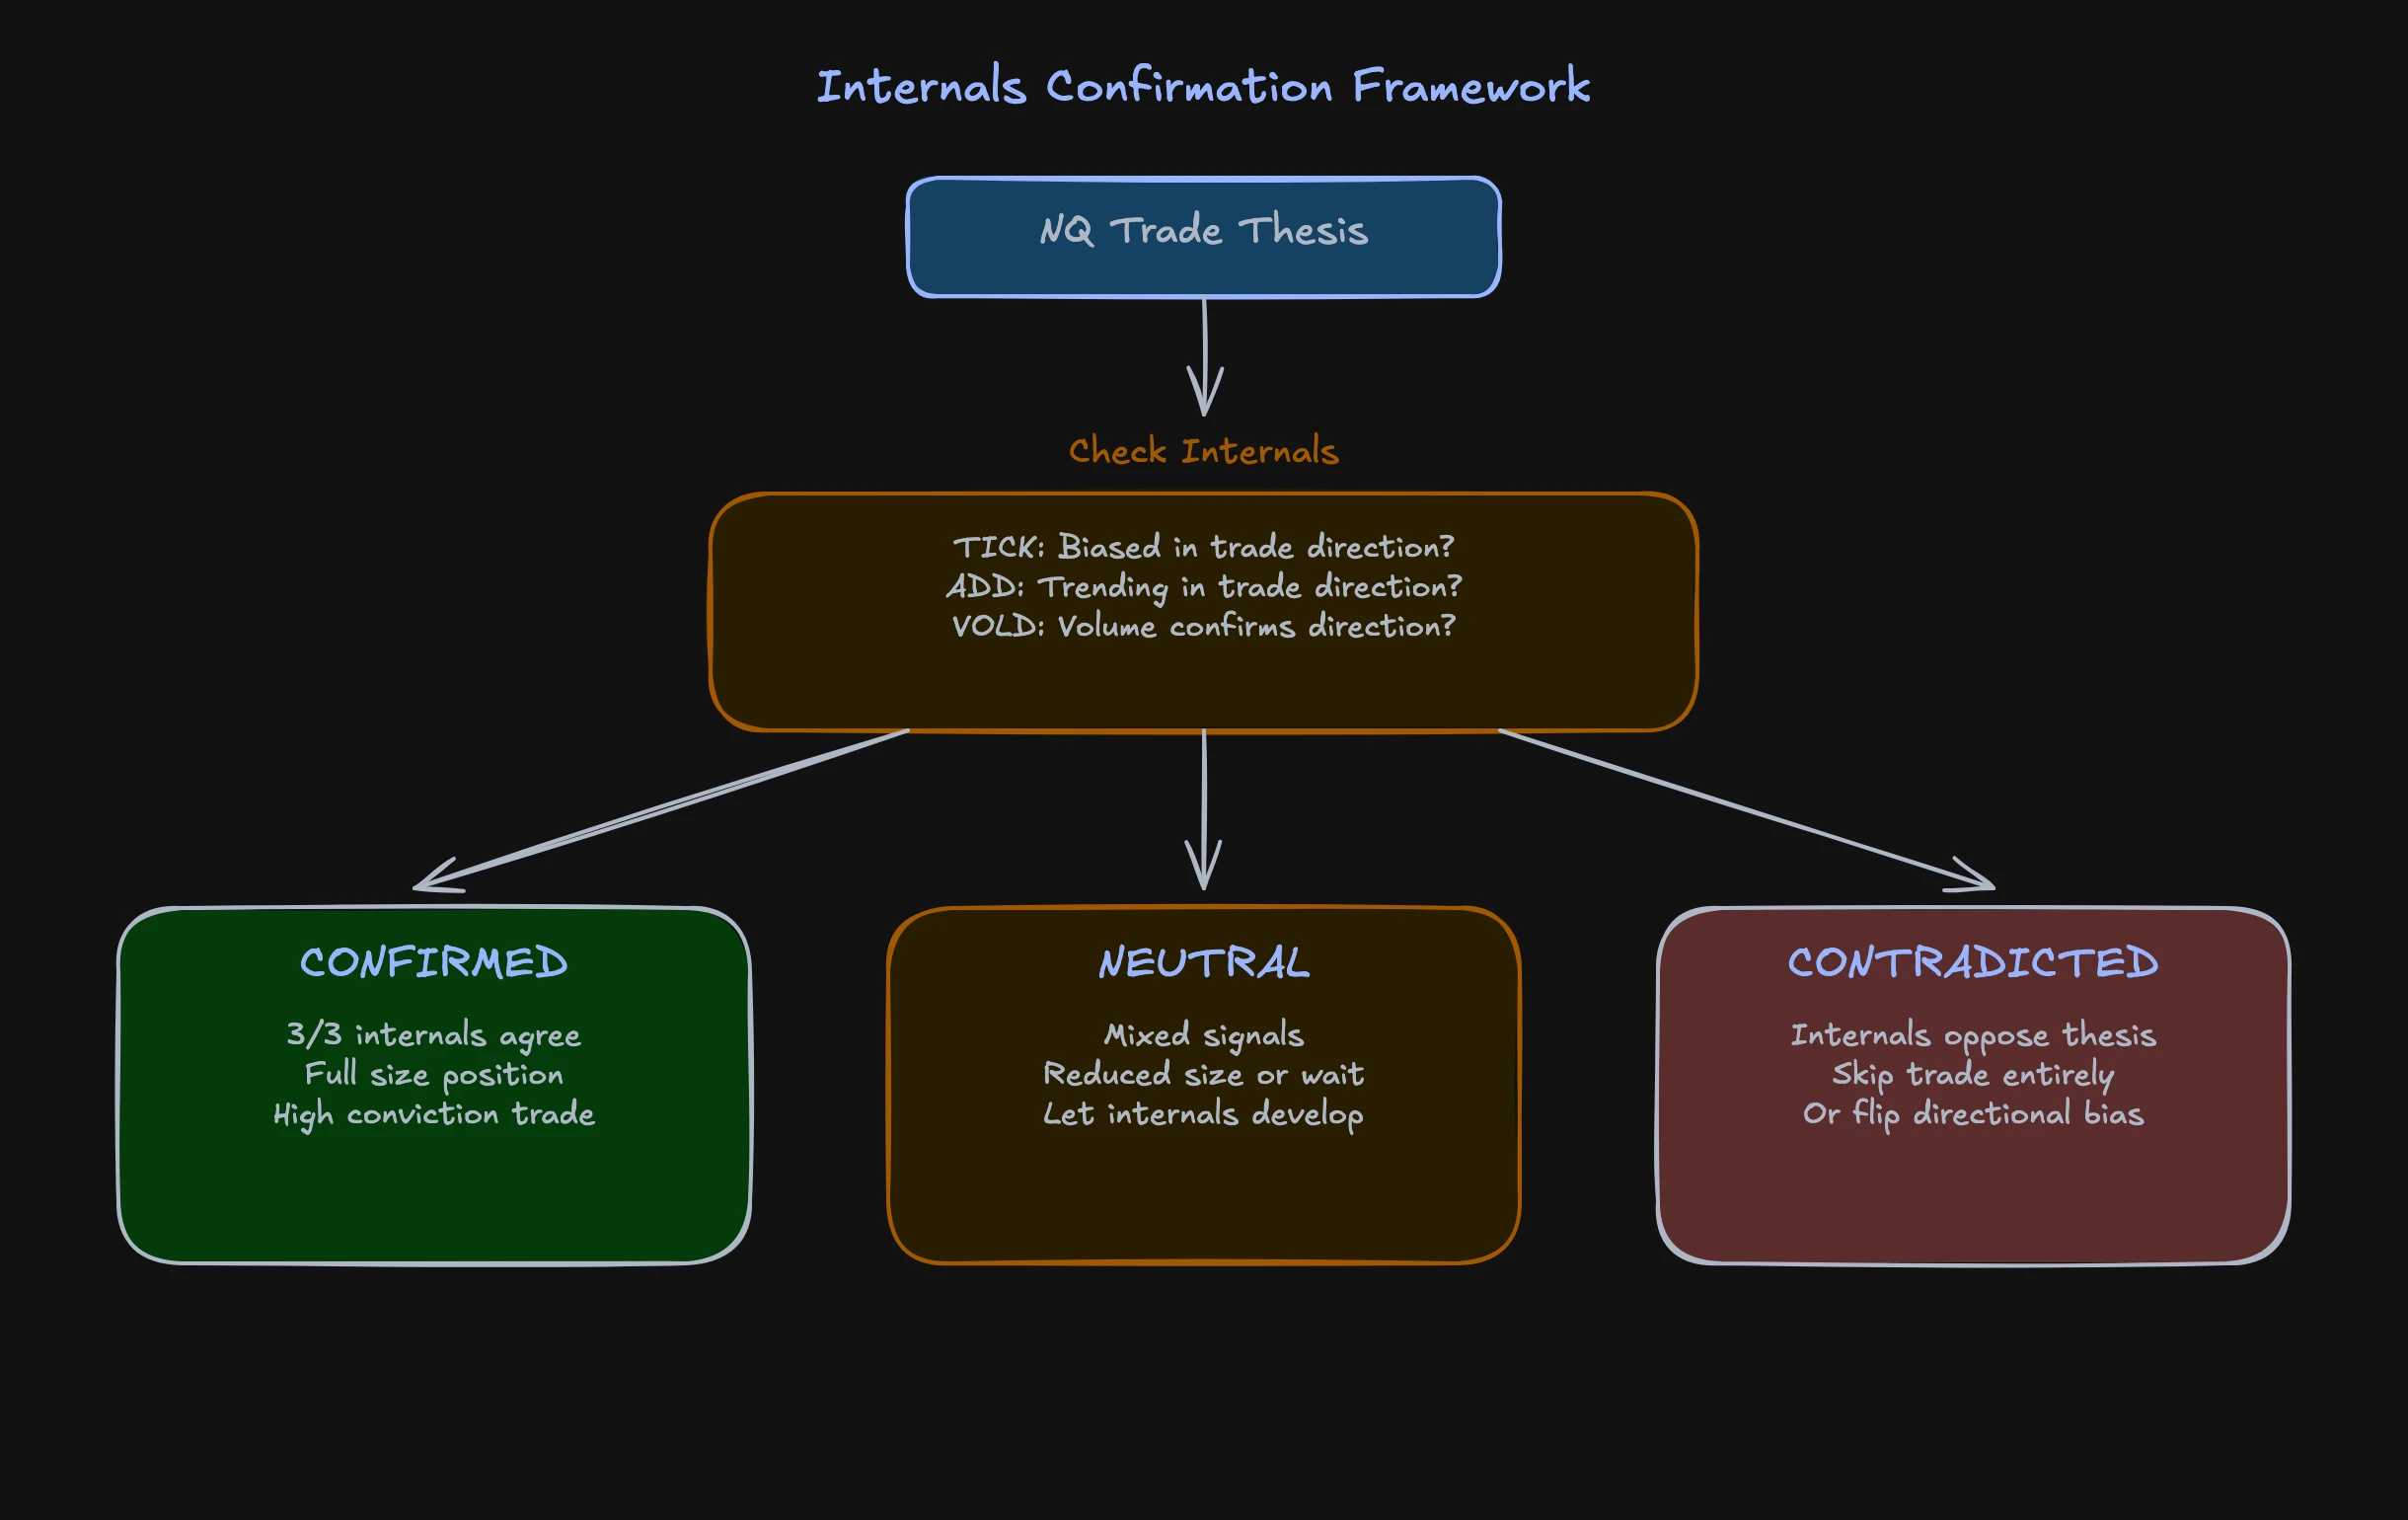
The Confirmation Framework
My framework is simple: internals confirm the thesis before I enter. No confirmation, no trade (or reduced size at minimum).
Strong confirmation looks like this:
- NQ at VWAP, I want to go long
- TICK is printing consistently above +400
- ADD is trending upward
- VOLD shows volume favoring advancers
All three internals agree with my directional bias. I take the trade with full size and confidence.
Weak confirmation looks like this:
- NQ at VWAP, I want to go long
- TICK is oscillating around zero
- ADD is flat
- VOLD is neutral
Internals are not contradicting me, but they're not supporting me either. I might take the trade with reduced size, or I wait for internals to develop a direction before entering.
Contradiction looks like this:
- NQ at VWAP, I want to go long
- TICK is consistently printing below -300
- ADD is falling
- VOLD shows volume favoring decliners
The broad market is selling while I'm trying to buy NQ. This trade goes against the weight of evidence. I skip it entirely, or I flip my bias to the short side if my order flow analysis supports it.
Reading TICK for NQ Entries
TICK is particularly useful for timing NQ entries. Here's my process:
- Identify the NQ setup (VWAP reversion, key level test, etc.)
- Check TICK baseline over the last 15-30 minutes. Is it biased positive or negative?
- Wait for a TICK extreme in your direction. For a long entry, I want to see at least one TICK print above +600, preferably +800. This tells me institutions are buying across the board right now.
- Enter on the NQ price level, not on the TICK reading itself. TICK confirms the timing, not the price.
- Monitor TICK after entry. If TICK flips strongly negative after my long entry, I tighten my stop or exit.
One pattern I see frequently: NQ pulls back to a level I like (VWAP, prior day's settlement, a volume profile node), and TICK drops below -600 as part of the pullback. Then TICK starts recovering, printing -400, -200, 0, +200 in quick succession. That recovery is my entry signal. The broad market panic is fading, and NQ should bounce with it.
NQ Internals Divergence Plays
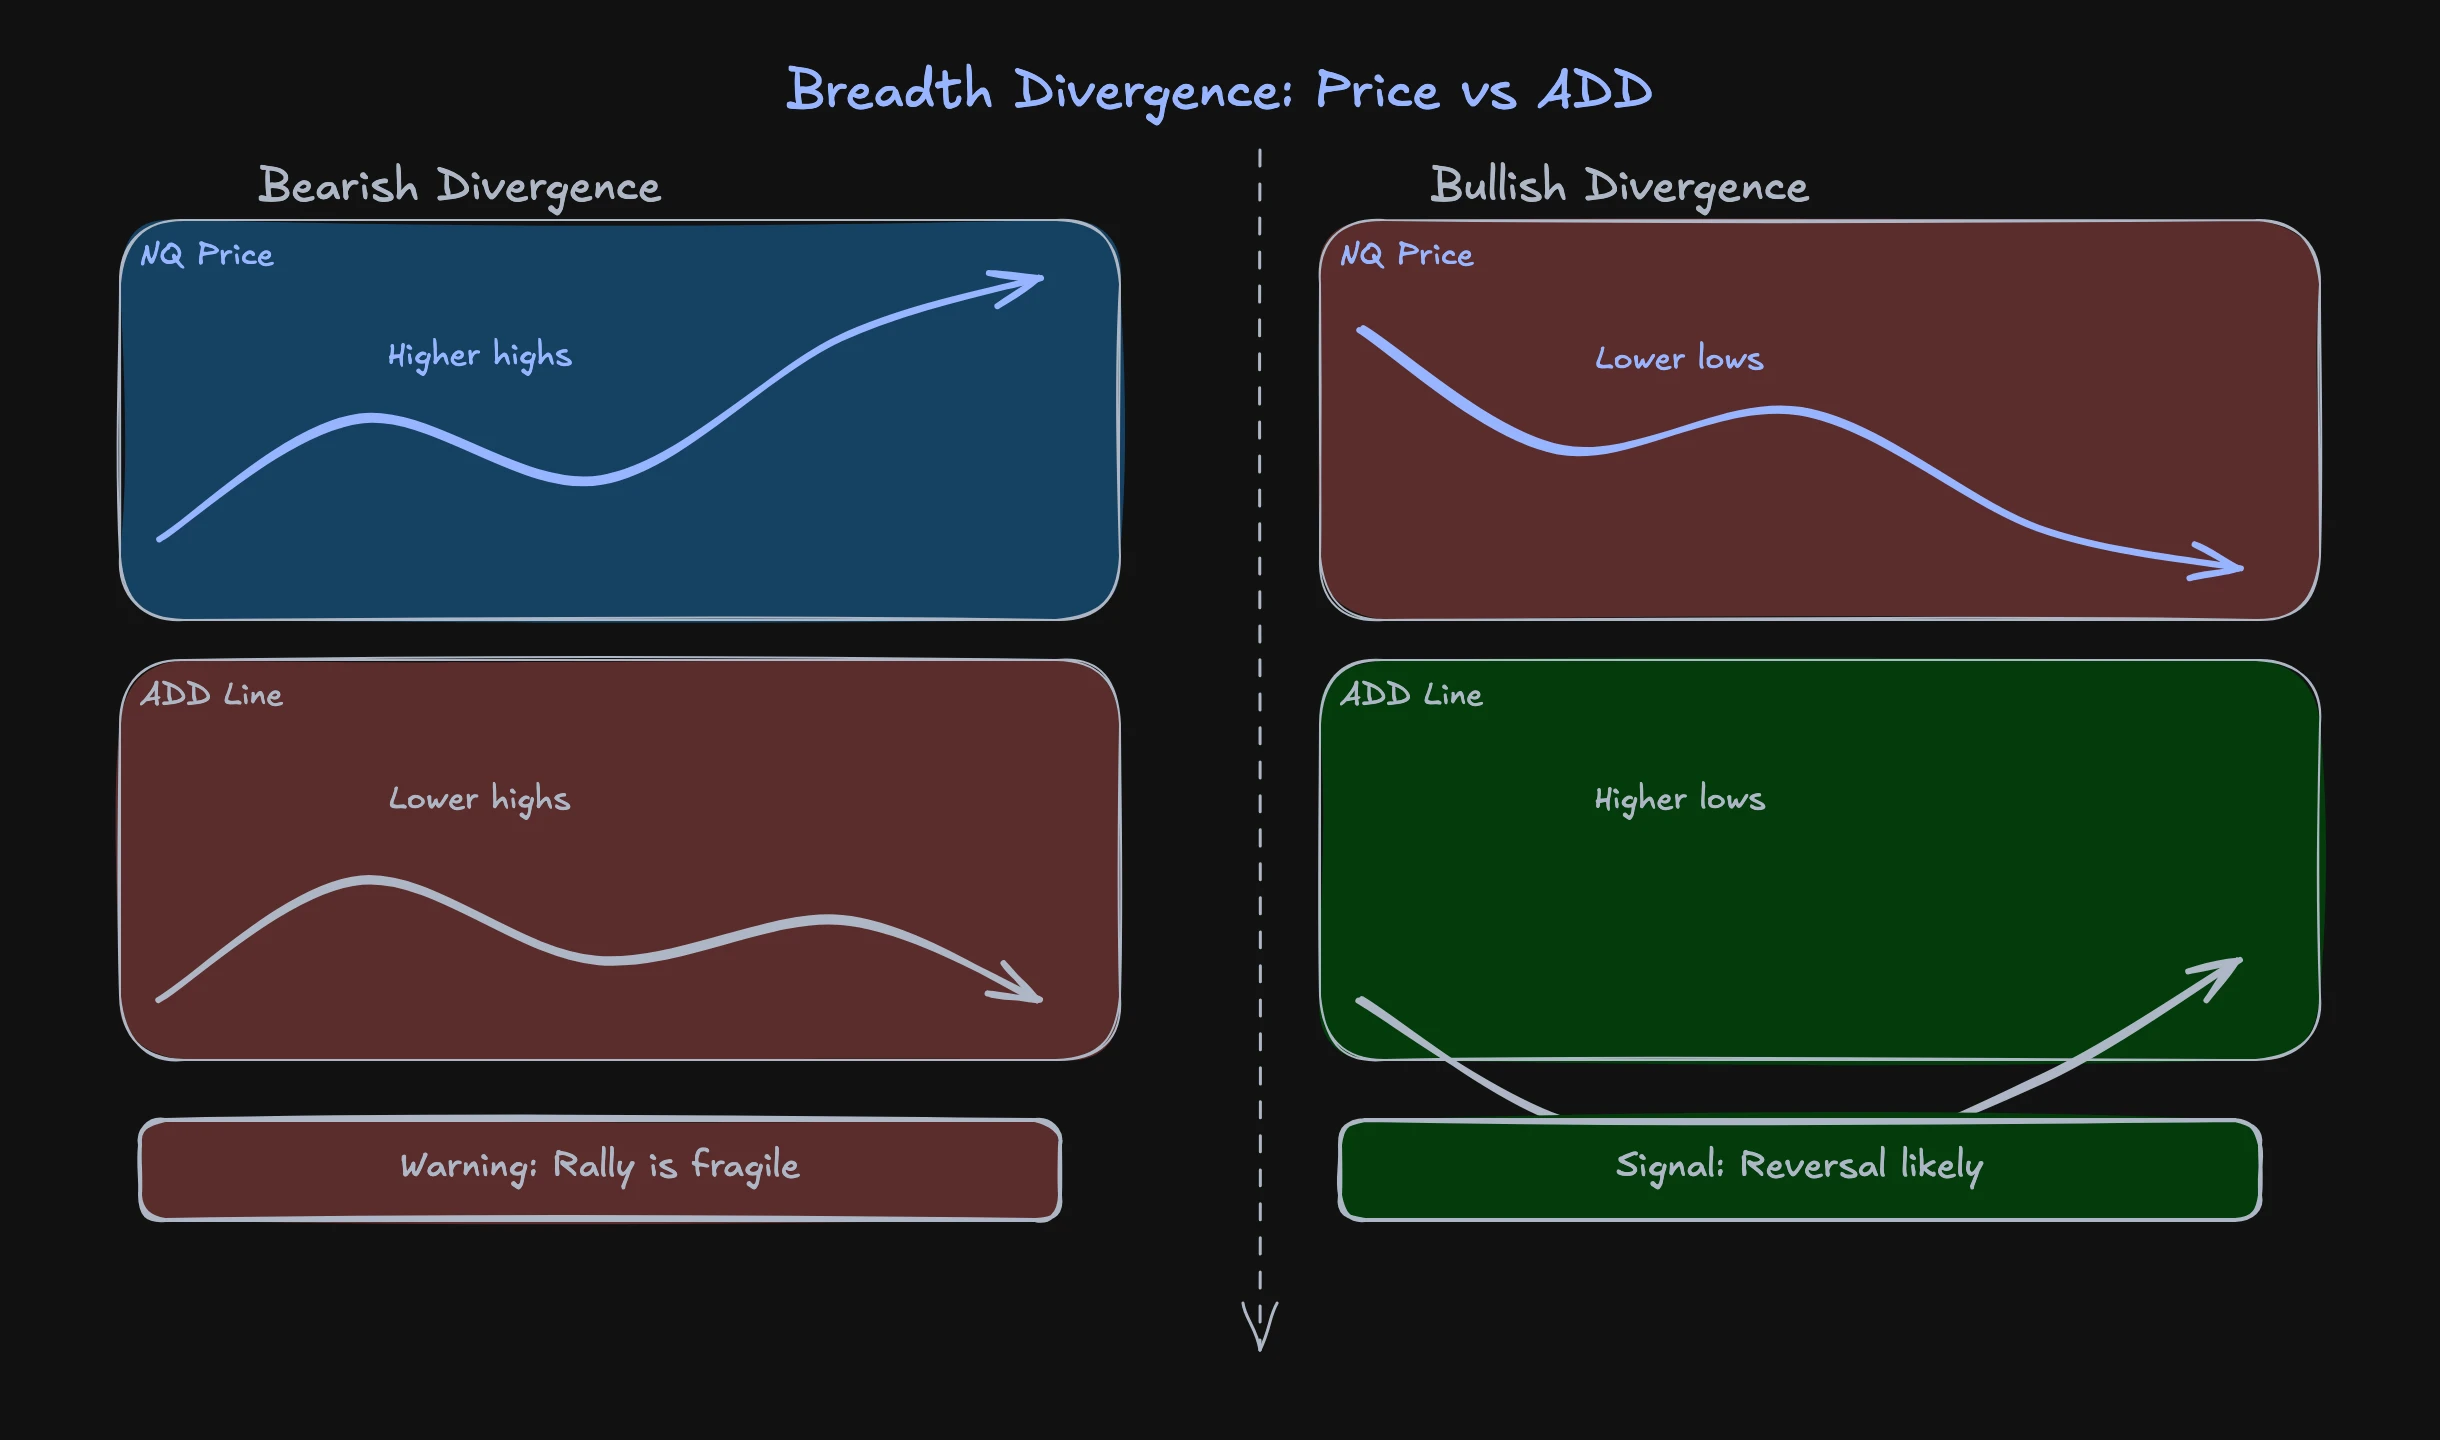
Divergences between NQ price and market internals are some of the highest-probability setups I trade. The logic is straightforward: if NQ is making new highs but the broad market isn't participating, the rally is unsustainable.
Bearish divergence example:
- NQ makes a new session high at 10:30 AM ET
- ADD peaked at 10:15 AM and has been declining since
- VOLD shows volume shifting to decliners
- TICK is no longer printing above +600
NQ's new high is not confirmed by breadth. I don't short blindly on this, but I know that any long entry here carries elevated risk. If I'm already long, this is where I take profits. If I'm flat, I'm watching for short setups.
Bullish divergence example:
- NQ makes a new session low at 2:00 PM ET
- ADD bottomed out at 1:30 PM and has been recovering
- VOLD shows volume shifting to advancers
- TICK prints are getting less negative
NQ is pushing lower, but the broad market already found its floor. This divergence often precedes a sharp NQ reversal, especially heading into the Power Hour.
Practical Setup: Adding Internals to Your Charts
Adding market internals to your trading setup takes about five minutes on most platforms. Here's what I recommend.
Chart Layout
I run a four-panel layout:
- Main chart: NQ 5-minute or 1-minute candles with VWAP and key levels
- TICK panel: $TICK (NYSE) as a line chart, with horizontal lines at +800 and -800
- ADD panel: $ADD (NYSE) as a line chart
- VOLD panel: $VOLD (NYSE) as a line chart
The internals panels don't need indicators layered on top. I want clean, raw data. A simple moving average on ADD can help you see the trend, but that's optional. The raw line tells me everything I need.
Platform Symbols
The symbols vary by platform:
| Platform | TICK | ADD | VOLD |
|---|---|---|---|
| Sierra Chart | $TICK | $ADD | $VOLD |
| TradingView | USI:TICK | USI:ADD | USI:UVOL-USI:DVOL |
| Thinkorswim | $TICK | $ADD | $VOLD |
| NinjaTrader | $TICK | $ADD | $VOLD |
Pre-Trade Checklist Using Internals
Before every trade, I run through this mental checklist:
- What does ADD say? Is the cumulative trend in my direction?
- What does TICK suggest? Are the recent extreme prints in my direction?
- Does VOLD confirm? Is volume flowing where I expect it to?
- Are there divergences? Does NQ price agree or disagree with internals?
- What's the macro context? Is there a macro event that could override internals?
If three out of five questions support my trade, I proceed. If two or fewer support it, I wait or skip.
Divergences: When Price and Breadth Disagree
Divergences between price and market internals deserve their own section because they are, in my experience, the single most reliable warning system in day trading. For a deeper exploration with real chart examples, see my article on market breadth divergences.
Classic NQ-ADD Divergence
This is the divergence I see most frequently: NQ is trending higher, making higher highs and higher lows on the chart. Everything looks bullish. But ADD peaked an hour ago and has been making lower highs since.
What's happening underneath: the mega-cap tech names (Apple, Microsoft, Nvidia, Amazon, Meta) are still pushing higher, which drags NQ up because of their massive index weight. But the other 95 Nasdaq stocks, and more importantly the broader NYSE, are already selling. Participation is narrowing.
This divergence doesn't mean "short immediately." It means "the probability of this rally extending much further is declining." In practice, I use it to:
- Take profits on existing long positions
- Avoid new long entries at stretched levels
- Begin watching for short setups at key resistance
TICK Divergence Patterns
TICK divergences are faster and shorter-lived than ADD divergences. They're useful for timing within a move.
Fading TICK extremes during a rally:
The first push in a rally might produce TICK prints of +900, +1,000, +850. The second push (NQ making new highs) produces +700, +650, +600. The third push: +500, +400. Each successive NQ high is accompanied by weaker TICK prints. Institutions are less aggressive with each push. The rally is running out of buyers.
TICK floor rising during a selloff:
NQ is selling off, but the lowest TICK readings are getting less negative. First dip: -900. Second dip: -700. Third dip: -500. Selling pressure is diminishing across the board, even as NQ continues to make new lows. The floor is rising, and a reversal is likely.
Volume Confirmation: VOLD as the Tiebreaker
When TICK and ADD disagree (which happens more often than you'd think), VOLD is my tiebreaker. VOLD tells me where the money is actually going.
Example: ADD is slightly positive (more stocks advancing), but TICK is oscillating around zero. Unclear picture. I check VOLD: volume is heavily favoring advancers. The advancing stocks might be fewer than the declining stocks, but the volume behind the advances is massive. VOLD breaks the tie: the market's money flow is bullish.
Limitations and Common Mistakes
Market internals are powerful, but they're not infallible. Knowing their limitations is just as important as knowing how to use them.
US Cash Session Only
TICK, ADD, and VOLD are NYSE-derived data. They only update during US cash market hours (9:30 AM to 4:00 PM ET). If you trade NQ during the Globex overnight session or the European morning, you have no internals data to work with.
This is a real limitation. I adjust by:
- Trading smaller size outside cash hours when I can't confirm with internals
- Using ES and NQ relative performance as a rough substitute for breadth during Globex
- Being more aggressive once cash opens and I can see real internals data
Don't Trade Internals as Signals
The biggest mistake I see traders make is treating TICK readings like trade signals. "TICK hit +1,000, buy!" That's not how this works. A TICK reading of +1,000 tells you that a broad buying program just swept through the market. It doesn't tell you where NQ is going next. It might mean the buying climax just happened and a pullback is imminent.
Internals are context, not signals. They modify the probability of your existing thesis. They don't generate trades on their own.
Earnings Season Distortions
During earnings season (particularly during the first two weeks when mega-caps report), market internals can give misleading readings. A single stock like Apple reporting after the bell can cause NQ to gap significantly while breadth is neutral because only one stock moved. Be cautious interpreting internals when individual stock events are dominating the tape.
TICK Spikes from MOC Imbalances
In the last 15 minutes of the trading session, Market on Close (MOC) orders create massive TICK spikes that have nothing to do with directional conviction. These are mechanical, rebalancing-driven moves. I generally ignore TICK readings after 3:45 PM ET for directional analysis.
Advanced: Combining Internals with Macro Context
Market internals tell you what the market is doing. Macroeconomic data tells you why. Combining both gives you a significant edge.
FOMC Days and Internals
On FOMC announcement days, internals before 2:00 PM ET are essentially noise. Traders are positioning, hedging, and reducing exposure ahead of the announcement. After the announcement, internals light up with real information.
What I watch: in the first 30 minutes after an FOMC statement, does ADD build a clear trend? If the Fed's message is dovish and ADD immediately starts trending up with VOLD confirming, that rally has legs. If the initial price spike is accompanied by flat or declining ADD, the market is uncertain, and the spike is likely to fade.
NFP Fridays
Non-Farm Payroll reports at 8:30 AM ET create a gap before cash open. When cash opens at 9:30, I watch the first 15 minutes of internals to determine whether the pre-market reaction will hold. If ADD immediately trends in the direction of the pre-market gap, the move is confirmed. If ADD trends against the gap, the pre-market move was a knee-jerk reaction, and a reversal is likely.
Weight of Evidence
In our mentoring program, we teach the concept of "weight of evidence" for trade decisions. Market internals are one pillar of this evidence. The framework looks like this:
- Technical thesis: Does the chart setup favor your direction?
- Order flow: Are aggressive orders supporting your thesis?
- Market internals: Is the broad market confirming?
- Macro context: Does the macro backdrop support this move?
When three or four pillars align, conviction is high. When only one or two align, the trade is speculative. Internals alone rarely justify a trade, but they frequently justify skipping one.
Frequently Asked Questions
What Are Market Internals in Trading?
Market internals are aggregate measures of individual stock behavior across an exchange. They include indicators like the TICK index (uptick vs. downtick count), the Advance-Decline line (advancing vs. declining stocks), and VOLD (volume on advancing vs. declining stocks). Unlike standard indicators that analyze a single chart, internals reveal the underlying health and breadth of the entire market. They help day traders understand whether a move in an index like NQ has broad market participation or is being driven by just a few stocks.
How Do I Use the TICK Index for Day Trading?
The TICK index is best used as a timing and confirmation tool, not a standalone signal. Monitor the NYSE TICK ($TICK) for extreme readings above +800 or below -800, which indicate institutional program trading. Use the overall TICK pattern (consistently positive, consistently negative, or neutral) to confirm your directional bias. For example, if you want to go long NQ at a support level, wait for TICK to show recovering prints moving from negative to positive before entering. Never buy simply because TICK hit an extreme, as that extreme might represent a climax rather than the start of a move.
Can I Use Market Internals for Instruments Other Than NQ?
Yes, but with caveats. NYSE internals (TICK, ADD, VOLD) measure broad stock market participation, so they're most directly relevant to equity index futures like NQ, ES, and YM. They're less useful for commodities, forex, or bond futures, though extreme readings can indicate risk-on or risk-off shifts that affect all asset classes. For NQ specifically, the connection is tight because the Nasdaq-100 companies are all NYSE or Nasdaq-listed stocks captured in these breadth measures.
What Is the Difference Between ADD and VOLD?
ADD counts the number of stocks: how many are advancing vs. declining. VOLD measures the volume: how much trading volume is flowing into advancing stocks vs. declining stocks. The distinction matters because 300 stocks can advance, but if they're all small-cap names with minimal volume while 200 declining stocks include mega-caps with heavy volume, the market's true direction favors the decliners. VOLD captures this volume-weighted reality that ADD misses. I use ADD as my primary breadth trend indicator and VOLD as a confirmation and tiebreaker tool.
Do Market Internals Work in Pre-Market or After-Hours?
No. NYSE TICK, ADD, and VOLD data are only available during US cash market hours (9:30 AM to 4:00 PM ET). During Globex overnight sessions, European morning trading, or pre-market hours, you cannot access these internals. This is a genuine limitation for overnight and early-session traders. During these hours, I rely more heavily on order flow analysis, relative performance between ES and NQ, and global macro context to fill the gap that missing internals leave.
In our mentoring program, you'll learn these concepts in over 1,500 video lessons with real chart examples. Market internals are just one part of our complete NQ trading framework, combining order flow, macro analysis, volume profiling, and breadth analysis into a unified approach.