Trading Nasdaq Futures (NQ): The Ultimate Day Trading Guide
Nasdaq Futures (NQ) are the most volatile among the major index futures. Where the S&P 500 (ES) moves 3 ticks, the NQ moves 40 ticks. That makes NQ the preferred instrument for day traders who work with order flow. In this guide, I'll show you what makes NQ special, which reference levels institutional traders watch, and how macro data and sentiment create trading opportunities. If you don't have experience with futures trading yet, start there with the basics.
Risk Disclaimer: Trading futures and other financial instruments carries substantial risk of loss. Past results are not indicative of future performance. Only use capital you can afford to lose.
Why NQ? What Makes the Nasdaq-100 Future Special
The NQ isn't just another index future. It's its own beast. Its volatility, market structure, and concentration in a few mega-cap stocks make it behave fundamentally differently than the S&P 500 or Dow Jones. You can find a detailed comparison of both indices in S&P 500 vs Nasdaq: Which Index Should You Trade?.
Volatility as an Advantage
The ratio is clear: where ES moves 3 ticks, NQ moves 40. This volatility isn't a disadvantage, it's an additional trading dimension.
In ES, you trade trends and manipulations. In NQ, a third type comes into play: volatility trading. Spikes, quick reversals, re-entries. We have an additional trading style that we don't have in ES.
The reason for this permanent volatility lies in the thin order book. NQ is a market with few contracts, but they're very valuable.
Unlike highly liquid markets like the Euro-Dollar future (6E), where volatility only emerges around news, NQ is volatile almost all the time. NQ just bounces around, creates trends in countless variations, and that's exactly what we can exploit as day traders.
Market-Maker-Driven Market
NQ is clearly a market-maker market. The roughly 100 Nasdaq stocks are almost all included in the S&P 500 as well. Market makers keep the spread between ES and NQ tight through convergence trading.
This interplay creates the typical, choppy NQ price movement: market makers bind NQ to ES and vice versa.
What does this mean practically? When ES moves, NQ follows, but with much larger amplitude. Market makers arbitrage the difference, and every small inefficiency between the two markets gets exploited immediately. The result is fast, often overshooting moves in NQ that aren't visible in ES. For day traders, this is an advantage: more movement means more opportunities.
Concentration in a Few Tech Giants
Index weighting works by modified market capitalization.
This means: individual companies like Apple, Google, and Microsoft are weighted so heavily that they can move the entire index on their own. When Apple drops 5% after earnings, you feel it directly in NQ. In the S&P 500, this effect spreads across 500 companies.
Add to that the special interest rate sensitivity: tech stocks react differently to rate changes than the old economy. A company like Caterpillar needs billions for inventory and machinery. A tech company can borrow money and convert it directly into growth because expenses are low. Rising rates hit tech growth valuations particularly hard, falling rates fuel them. This makes NQ reactions to Fed decisions particularly predictable and tradeable.
Contract Specifications
| E-mini NQ (NQ) | Micro E-mini NQ (MNQ) | |
|---|---|---|
| Point value | $20 per point | $2 per point |
| Tick value | $5 per tick | $0.50 per tick |
| Ticks per point | 4 | 4 |
| Typical stop (50 points) | $1,000 risk | $100 risk |
For getting started with a smaller account, Micro Futures (MNQ) are ideal: you trade the same market with 1/10 of the risk. More on this in the Micro Futures guide.
Sessions and Trading Hours: When NQ Is Really Tradeable
NQ futures trade almost 24 hours a day, but not every hour is equal. Liquidity, and therefore the quality of your setups, depends directly on when you trade. Institutional volume concentrates on a few hours, and that's exactly where you should be.
The Most Important Sessions
Globex Session: From Sunday 18:00 ET to Friday 17:00 ET, NQ runs almost continuously. Outside the main sessions, however, liquidity is thin and spreads are wider.
European Overlap: Starting at 09:00 London time, volume rises noticeably. European traders set the initial direction for the day. What happens in this phase influences the US session.
US Cash Open (15:30 CET / 09:30 ET): This is THE session. Maximum volume, maximum liquidity, maximum opportunity. The first 90 minutes after cash open concentrate the bulk of institutional NQ volume.
Power Hour (21:00-22:00 CET / 15:00-16:00 ET): End-of-day rebalancing by ETF providers and fund managers increases volatility once more toward the end of the day.
Three VWAPs for Three Sessions
A normal VWAP (Volume Weighted Average Price) shows the volume-weighted average price. Unlike a moving average, it's not a pure price average: when a lot is traded, VWAP moves more. When little is traded, it barely moves, even if the price is far above it.
For NQ, I use three VWAPs, each representing its own session:
1. The Daily VWAP runs all day, from session start to end. It gets influenced more strongly once the US session opens because that's where most volume comes in. I always have it on my chart because simplicity in trading is more important than perfection.
2. The EU VWAP starts at 09:00 London time and runs until 15:30, when the American markets open.
It shows specifically what European traders are doing. This is relevant because the American markets orient themselves partly on the European session.
3. The US VWAP runs from cash open to market close.
For the US session, it's tendentially even more important than the daily VWAP. Sometimes you wonder why the price turns away from or breaks through the daily VWAP and reacts somewhere else. Switch on the US VWAP and you see: there was another one.
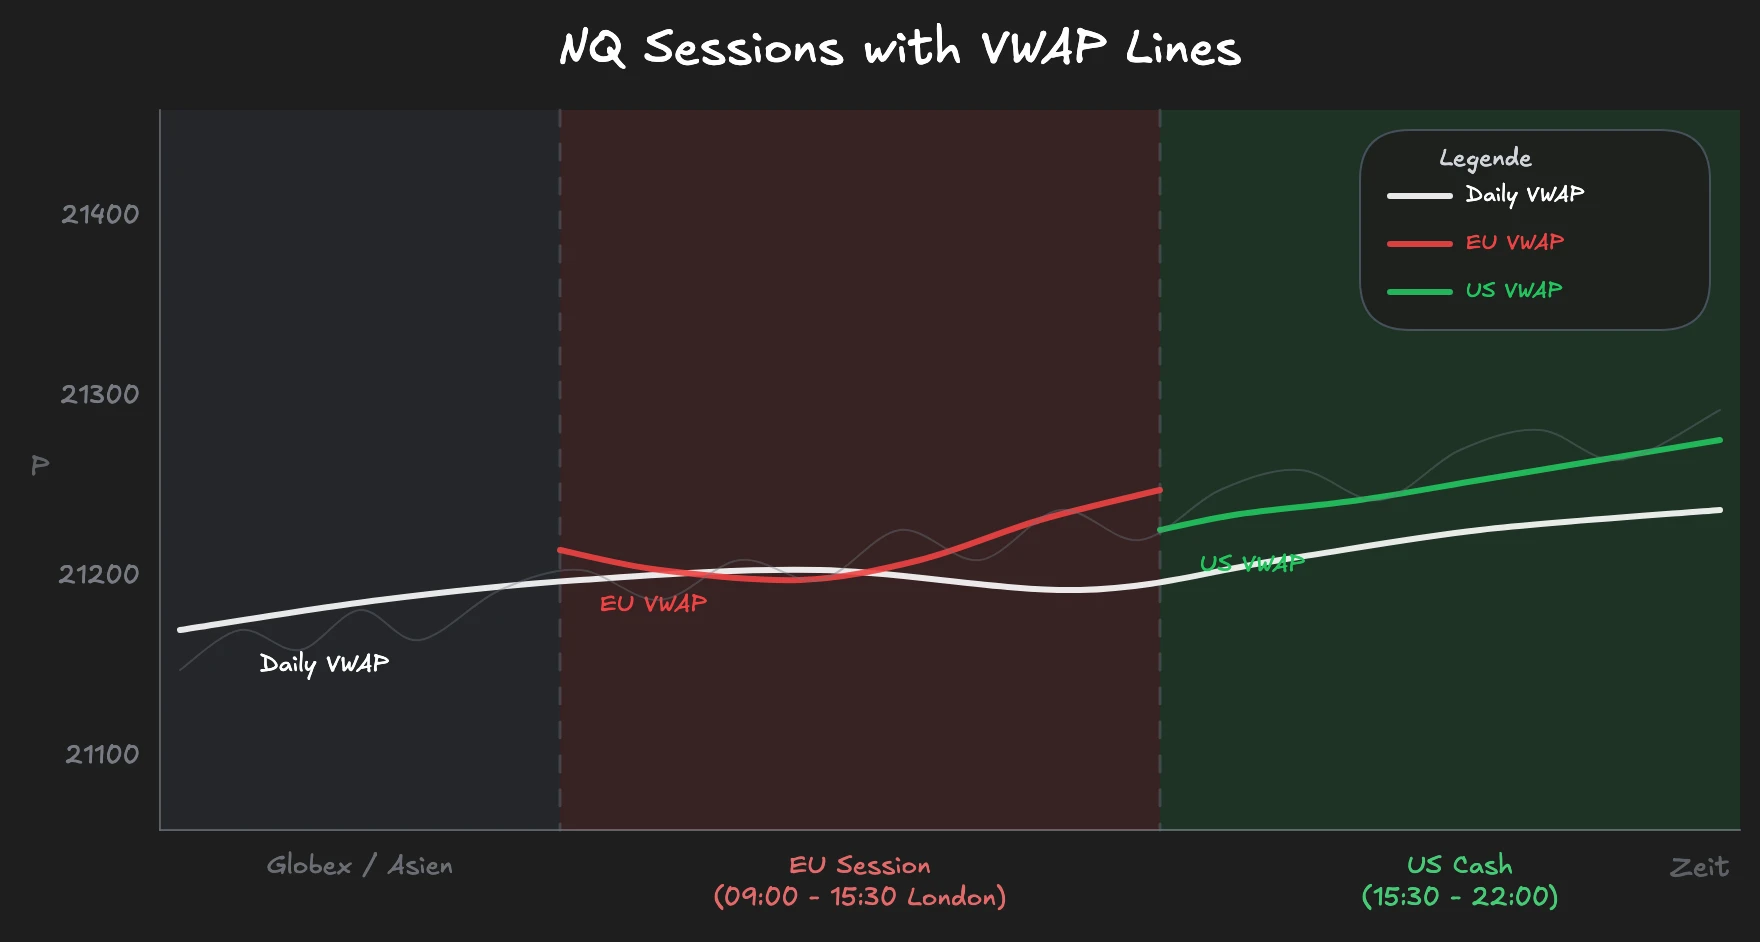
This three-way split lets you see specifically which session is currently dominating the market. Combined with Volume Profile, a clear picture of session-based volume distribution emerges.
The Three Market Phases in NQ
Every NQ session falls into one of three market phases. Which phase is currently active determines which tools and approach work.
Trading a trend setup in a range market is the surest way to lose money.
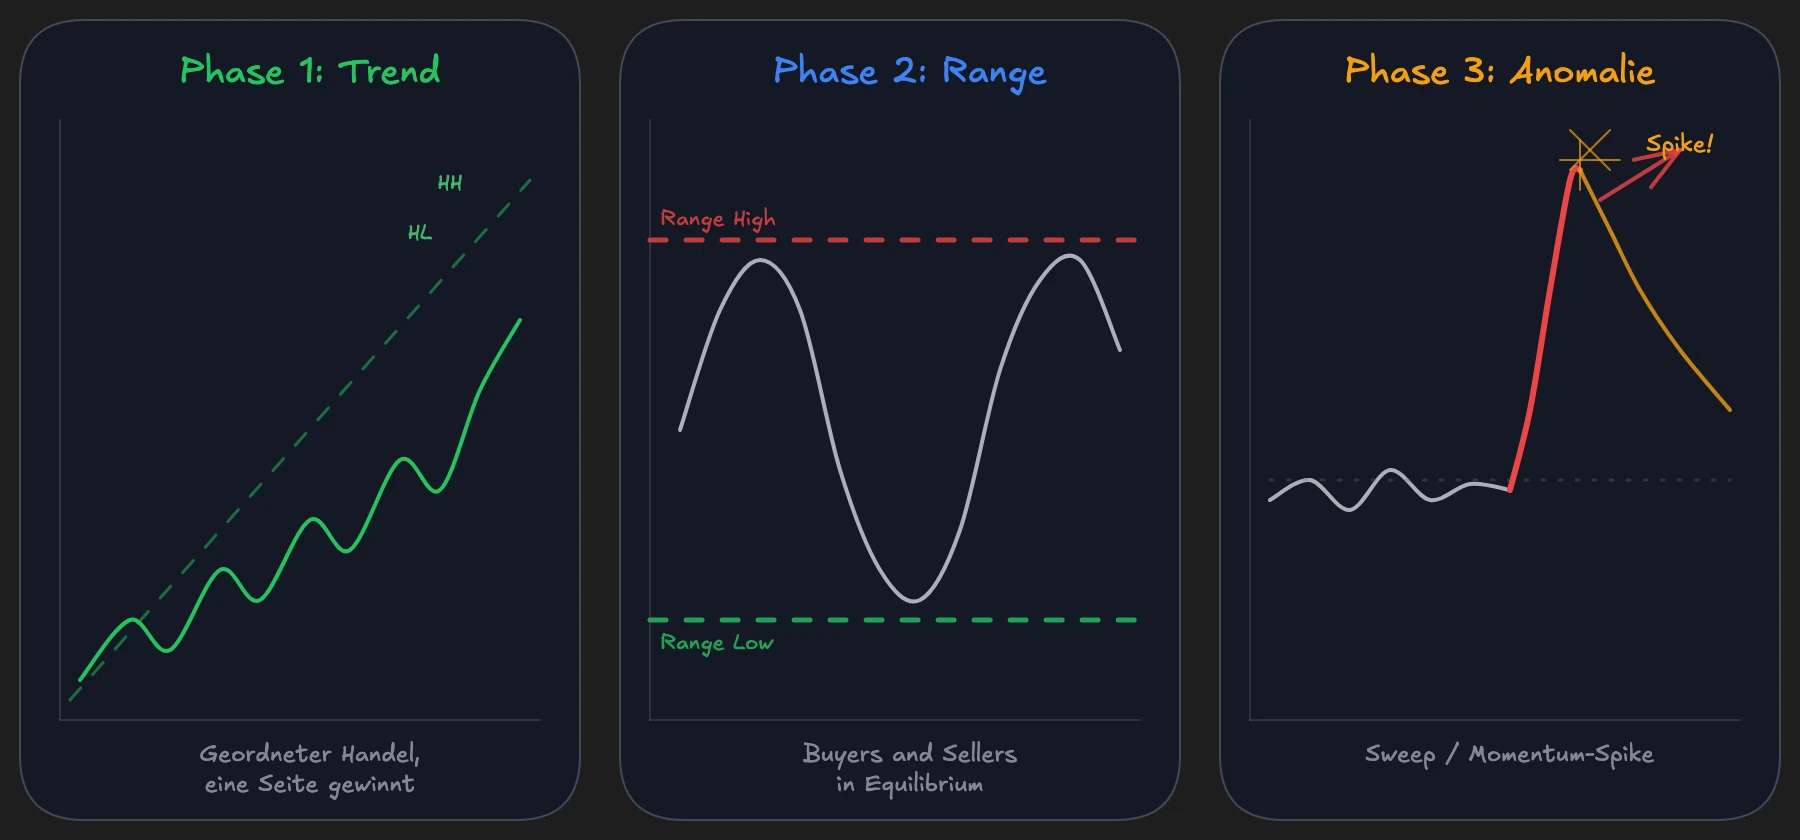
Phase 1: Trend Markets
In a trend phase, both sides, bulls and bears, trade actively. But one side wins over a longer period. What's special: these aren't extreme, exaggerated movements. It's balanced, orderly trading where the price steadily moves in one direction.
For us as day traders and scalpers, this is paradise. You can easily trade long from A to B, or briefly go countertrend short and then re-enter with the trend. Larger market participants can hardly execute countertrend because their position sizes are too big to quickly enter and exit. But we as small traders have exactly this advantage: we can trade both directions within a clear trend context.
A common mistake: traders confuse a trend with a one-sided movement without resistance. In a real trend phase, bulls and bears trade, but one side wins long-term. This isn't a crash, not panic buying. It's balanced, orderly trading with a clear winner.
Phase 2: Range Markets
Range markets occur much more often than trend phases. The majority of the time, the market is in a range phase. Even within trend phases, there are smaller sub-ranges.
In a range, buyers and sellers face each other equally. Neither dominates, the price oscillates between two extremes. The key is identifying the high, the low, and the middle of the range. At the extremes, you look for reversal patterns, in the middle you avoid trades because there's no clear direction.
VWAP reversion works particularly well in range phases because the price repeatedly returns to the volume-weighted average. VWAP acts like a magnet in the range: if the price moves too far away, it pulls it back. Combined with the range boundaries, clear zones for entries and exits emerge.
Important: Even within range phases, there are manipulations. The price can briefly spike above the range high, trigger stops, and immediately come back. If you recognize this, you have an advantage over traders who buy the breakout.
Phase 3: Anomalies
Sweeps, momentum spikes, price anomalies. These are movements that don't fit the previous pattern. In an uptrend with steady slope, a sharp breakdown suddenly occurs. In a sideways market, the price shoots in one direction without warning.
A market order sweep means: someone is trading exorbitantly high sums compared to what's offered via limit. The order book gets swept clean. This isn't a normal market movement, and it requires different risk management.
The transitions between phases are fluid. A trend can transition into a range at any time, and from a range, an anomaly can emerge. What's crucial: recognize which phase you're in before you place a trade. Your setup must match the current phase, otherwise you're trading against market structure. You can find concrete strategies for all three phases in the article 3 Nasdaq Trading Strategies.
Institutional Reference Levels: What Pros Watch in NQ
These levels move NQ daily. Most retail traders don't even know half of them. Each of these levels has a concrete reason why institutional traders become active there.
Settlement Price
The settlement price is the official closing price of the NQ future. It's calculated as the volume-weighted average (VWAP) of trades in the last 30 seconds of regular trading time (14:59:30 to 15:00:00 CT). You can find it daily on the CME Group website.
Why is this price so important? All ETF portfolio valuations use the previous day's settlement price. BlackRock, Vanguard, and all other large fund providers value their portfolios based on this price. If their weighting deviates from target, they rebalance. These trades are mandated, they must happen.
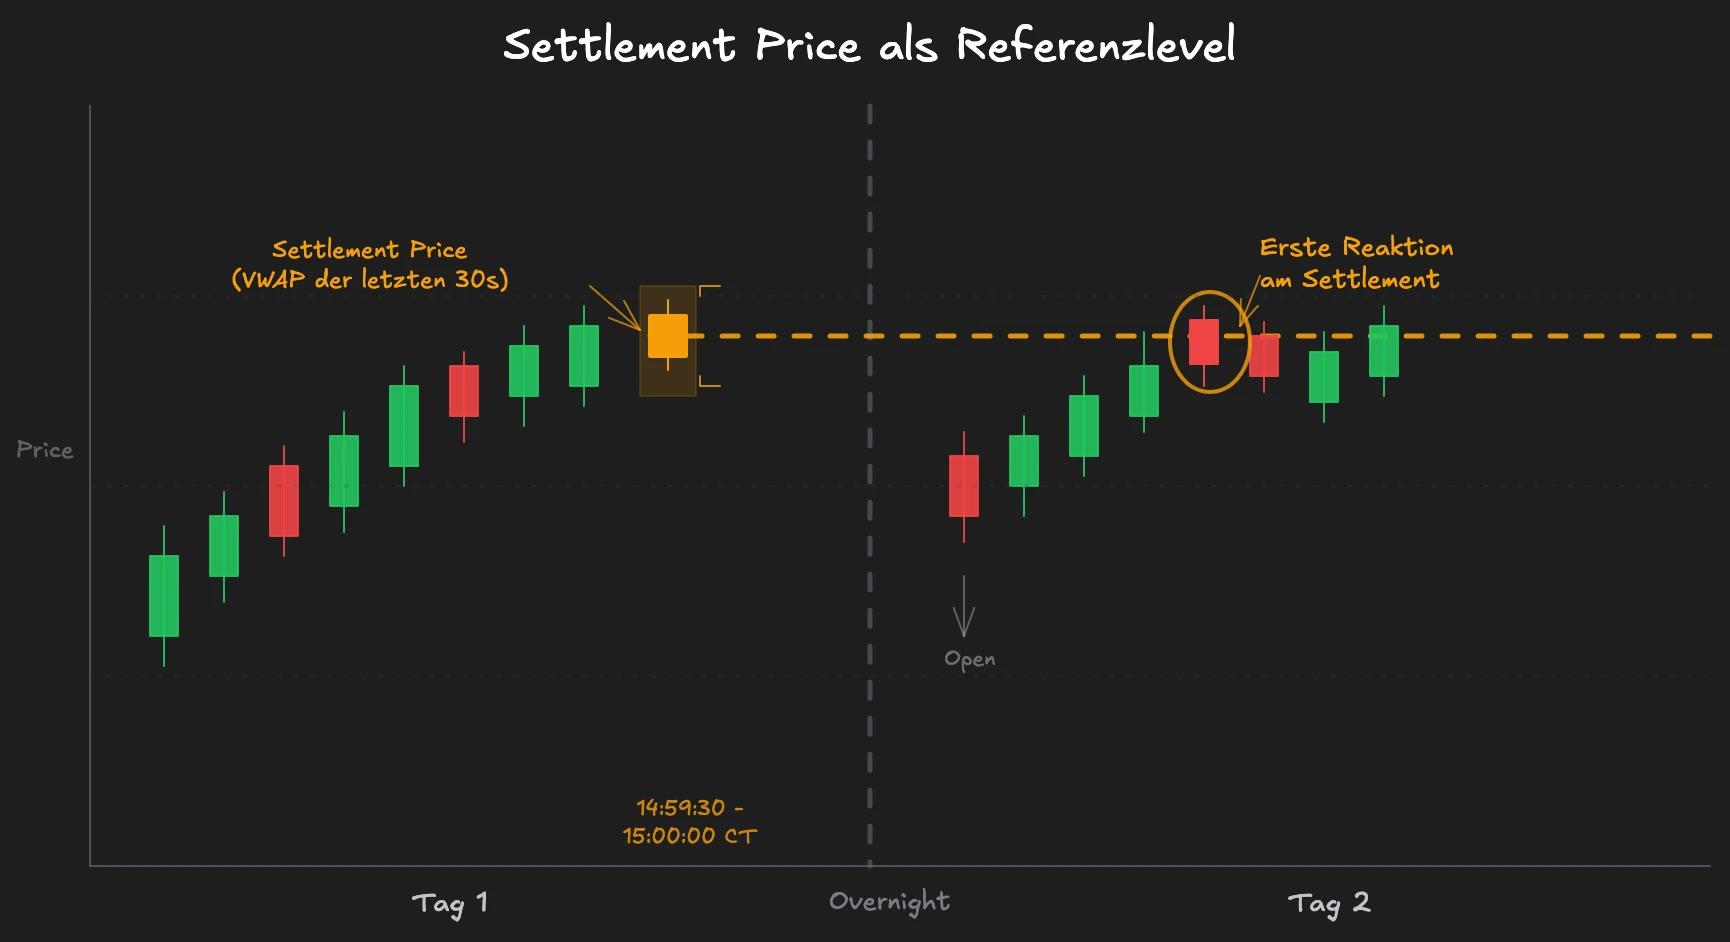
The trading application: draw the settlement price as a daily reference line. The market often pauses or reacts at this level because real institutional activity takes place there. The first touch of settlement price on the following day is often the cleanest. It's yesterday's weighted average price, and that's exactly why it has its justification as a reference for short-term scalps.
What's special about settlement price: it's not a technical level that traders draw themselves. It's a fundamental price where real money moves. ETF rebalancing, margin calculations, portfolio valuations, everything references this one price. If you don't have it on your radar, you're missing a level that institutional traders watch daily.
Previous Day High and Low
The previous day's high and low are the most watched levels among all market participants. At these prices, stop-loss orders collect, making them potential liquidity zones.
The institutional reading: a break of the previous day high doesn't automatically mean bullish continuation. It can be a stop run where liquidity above the high gets swept before the market turns. Only when you see in the order flow whether real demand is behind the break can you judge whether it's a breakout or a trap.
Opening Range
The opening range is the price span of the first 15 to 30 minutes after US cash open. It sets the directional bias for the entire trading day because in this phase, the largest market participants build their positions. A break up or down defines the initial directional bias.
The opening range isn't a magical level. The volume of this phase determines where the market gets fairly priced, and breaks from it signal a change in this assessment.
In NQ, the opening range is particularly meaningful because volume in the first 15 minutes after cash open often exceeds the entire overnight volume. The market condenses in no time where the fair price for the day lies. A break of this range with volume has a different quality than a break during lunch hour when hardly anyone is trading.
Options Levels
Options levels are particularly important for indices. Professional market participants use options to hedge their positions. Market makers sell (write) options and hedge their risk via NQ futures. This creates mechanical price zones.
At strikes with high open interest, especially at round thousand marks like 20,000, 20,500, or 21,000, congestion occurs instead of breakouts. Market makers have to hedge actively there, and this creates a kind of magnetic effect on the price.
Two terms you should know: Gamma Exposure and Max Pain. Gamma Exposure describes how strongly market makers have to adjust their hedges when the price moves. Market makers sell options and must neutralize their risk via futures (stay delta-neutral). If the price rises toward a call with high open interest, they have to buy NQ futures. If it falls toward a put, they have to sell. This mechanical buying and selling amplifies movements in some directions and dampens them in others. Max Pain is the strike where most options expire worthless, so the price where option buyers suffer the largest total loss. Market makers profit when the price moves toward max pain, and their hedging activity creates exactly this tendency. Both concepts together explain why the NQ price seems stuck at certain strikes and consolidates there for hours before moving on.
Daily and weekly options with near expiration have the strongest influence on current price movement. The closer to expiration, the more actively market makers must hedge, and the stronger the effect on the NQ price.
This topic is covered by practically no German-language provider, although it's one of the most concrete mechanisms that explain NQ price movements. If you understand where the large options clusters lie, you know where the market will likely consolidate and where it can break through.
Macro and Sentiment: What Really Moves NQ
Macroeconomics determines direction. Sentiment determines form. That's the central distinction most traders don't make.
Understanding both levels gives you a structural advantage in NQ.
The Four Macro Drivers
GDP (Gross Domestic Product): The ultimate measurement tool for economic growth. Nasdaq companies are part of American GDP. When America grows, these companies should grow. GDP is the most important of all data points.
Inflation: Makes corporate profits relatively worthless. 20% nominal earnings growth with 22% inflation means: the company is shrinking in real terms. For NQ, inflation is particularly relevant because tech growth valuations suffer disproportionately when inflation rises.
Labor Market Data: The index consists of companies, and companies have employees. Strong employment means strong GDP, means stronger index. The direct connection is simple, but it works.
PMIs (Purchasing Managers' Index): Purchasers in companies are surveyed directly: how does the order situation look? What's coming in the next months? PMIs aren't a lagging indicator. They look 2 to 3 months into the future because they survey the people who actually have the order books in hand.
Sentiment: The Short-Term Trend Driver
Sentiment is the difference between expectation and reality. A triangle emerges: the last known value, the expected value, and the actual new value.
A concrete example: the last PMI reading was 51.5. The market expects 60. Two to three days before the release, many trade long based on this expectation. The price rises. Then the news comes: 56 instead of 60. Objectively, 56 is better than 51.5. But the market has already priced in 60. The reaction is suddenly bearish, the price likely falls lower than before the rise.
That's sentiment. Not the absolute value counts, but the deviation from expectation.
Why is this particularly relevant for NQ? Macro data gets built into prices via ETF activity. Once sentiment is known, it's somewhat priced in. But NQ volatility still allows you to find good entries repeatedly. In ES, the movement would be over. In NQ, you still have re-entries, even when everything is already known.
Economic Calendar as Requirement
You don't have to know every data point. Focus on HIGH-impact events: Fed decisions, NFP, CPI, PMI. Everything else is noise. You can find detailed strategies for individual data events in the guides on NFP Trading and the Economic Calendar.
The practical rule: reduce your position size or go flat before high-impact releases. NQ can move 100 points within seconds on an NFP miss. Anyone with full position size on the wrong side learns an expensive lesson.
Failed Structure: When the Expected Move Doesn't Come
Failed Structure is one of the most profitable concepts in NQ trading, and simultaneously one of the least understood. The basic idea: always think the opposite of what's currently happening. What's given, what should normally happen, and what if this normally doesn't happen?
The Principle
In an uptrend, the price makes a new high. The expectation: further long movement. But the price turns. The new high doesn't hold, the market comes back. That's Failed Structure. In a range market, the price breaks out downward. The expectation: new downtrend. But the price immediately returns to the range. That's also Failed Structure.
Why Especially in NQ?
NQ volatility makes Failed Structures more frequent than in other markets. The thin liquidity means breakouts happen quickly, but fail just as quickly. And exactly these failure points are often the sharpest moves of the day.
Failed Structure is directly connected to stop runs: a stop run that doesn't create follow-through is by definition a Failed Structure. You find confirmation in the footprint chart and in spotting big trades. If no institutional buyers or sellers become active during the breakout, the probability of failure is high.
The concept is harder to master than normal entry strategies. But in return, you have trading opportunities almost everywhere because you don't just think in one direction, but always keep the opposite side in view.
FAQ: Trading Nasdaq Futures
What's the Difference Between NQ and QQQ?
NQ is the E-mini Nasdaq-100 future, traded at the CME, with $20 per point, real leverage, and full order book with volume data. QQQ is the Invesco Nasdaq-100 ETF, traded on exchanges, without leverage and without order flow data.
Both track the Nasdaq-100 index, but data quality differs fundamentally. With NQ, you see every single order in the order book, every absorption, every imbalance. With QQQ, you only see the price and aggregated volume across multiple exchanges. For day trading with order flow analysis, NQ is the only option because QQQ doesn't give you the data you need for informed decisions.
Do I Need a Large Account for NQ Trading?
For the E-mini NQ ($20 per point), you need serious capital. A 50-point stop means $1,000 risk per contract. The Micro E-mini NQ (MNQ) reduces this by a factor of 10: the same stop costs $100. With a $5,000 account and a 1-2% risk limit, 1 to 2 MNQ contracts are appropriate. In the Micro Futures guide, you'll find a detailed guide for getting started with a small account.
Is a Candlestick Chart Enough for NQ Trading?
You can trade NQ with candlesticks, but you don't see what happens inside the candle. The thin NQ order book especially means order flow signals like absorptions, imbalances, and big trades are particularly pronounced. For serious NQ day trading, footprint charts, Volume Profile, and big trade recognition give you the advantage you need. The right software is the starting point.
Conclusion: Depth Beats Breadth
NQ rewards depth over breadth. Someone who truly understands one market, its sessions, its reference levels, its reaction to macro data, has a structural advantage over traders who scan five markets simultaneously. Every level in this guide exists for a concrete reason: settlement price, because ETFs rebalance there. VWAP, because volume defines the fair price. Options levels, because market makers hedge mechanically there. When you not only know these connections but apply them daily, you no longer trade NQ blindly. You trade it with context.
In our mentoring program, you'll learn these concepts in over 1,500 video lessons with real chart examples. From settlement price to order flow to options levels: everything is taught with practical application.