Volatility Regimes: Why Your Strategy Suddenly Stops Working
Volatility regimes are the reason a trading strategy makes money for weeks and then stops working without any apparent mistake on your part. The regime changed, not your skills. The ability to classify the current market state before placing your first trade is the single most important skill I learned in professional trading.
Risk Disclaimer: Trading futures and other financial instruments involves significant risk of loss. Past results are not indicative of future performance. Only trade with capital you can afford to lose.
The #1 Question: "My Strategy Worked, Then It Stopped"
I hear this constantly. A trader finds a strategy that's profitable for three weeks. VWAP reversion, breakout trading, scalping at the Value Area. Then two weeks of losses follow. The conclusion: "The strategy doesn't work" or "I need to find something new."
Both conclusions are wrong. The problem is almost never the strategy. The problem is that the strategy was built for a specific volatility regime and is now being applied in a different one.
A concrete example: you trade VWAP reversion on NQ. For three weeks, the VIX sits at 13 to 15, ranges are tight, price oscillates around VWAP. Your strategy produces 60% win rate with clean 1.5:1 risk-reward. Then rates spike, the VIX jumps to 28, and suddenly you lose five trades in a row. Not because you made mistakes, but because VWAP reversion doesn't work in a trending regime.
The Three Volatility Regimes
In our NQ Masterclass framework, we classify every market into three states. This classification isn't exotic. Institutional hedge funds use automated regime detection algorithms that do fundamentally the same thing.
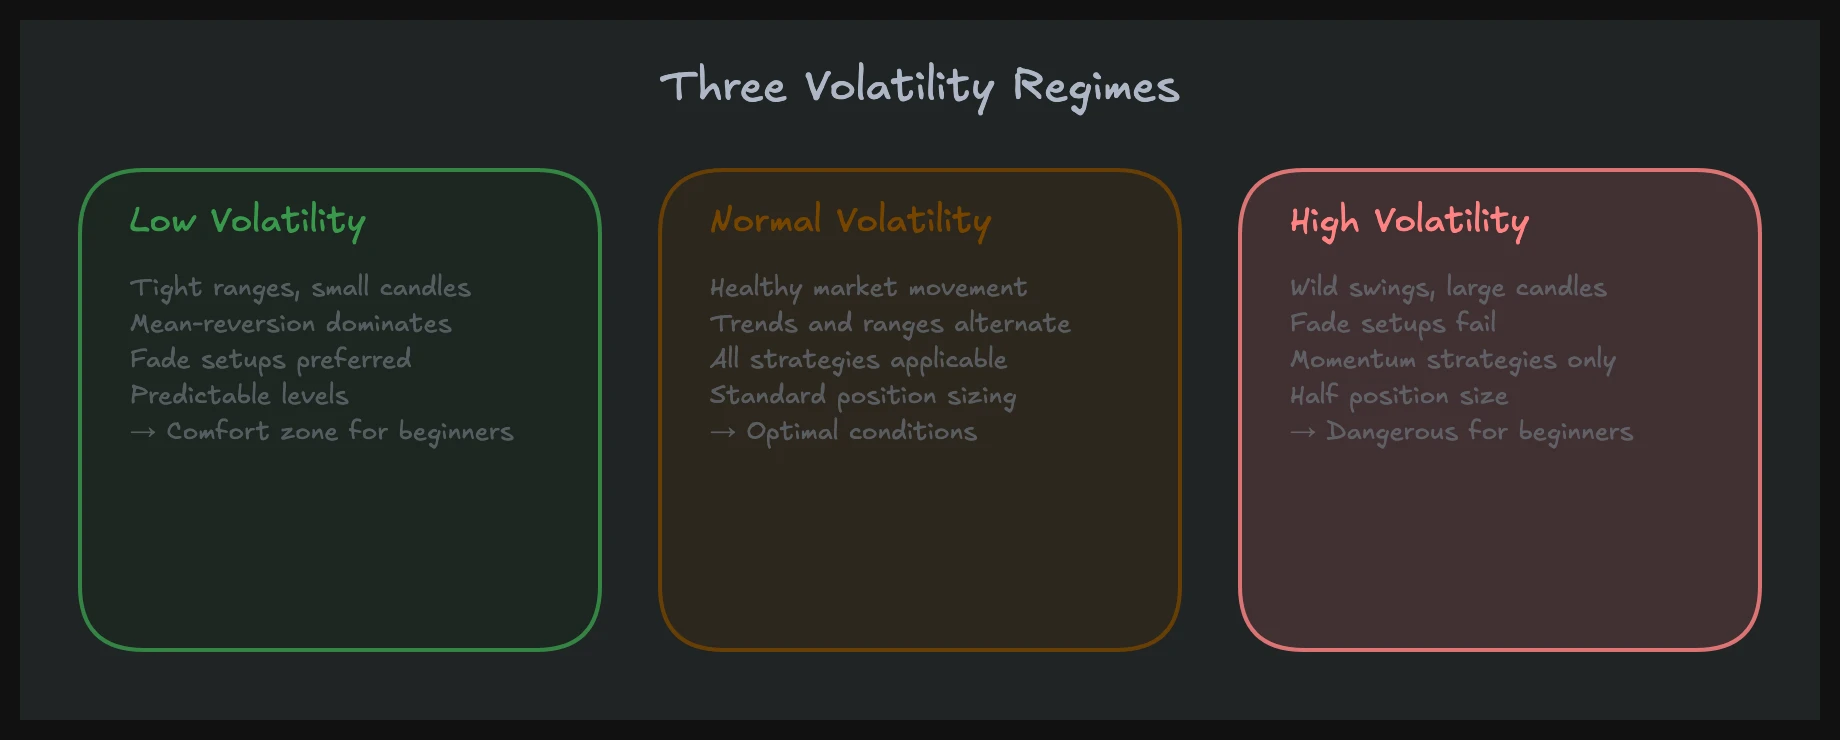
Low Volatility (VIX Below 15)
Characteristics:
- NQ daily ranges: 80 to 150 points
- ~70% of days are range days
- Volume Profile shows D-shape (volume concentrated in the middle)
- VWAP is relatively flat
- Breakouts frequently fail
What works: Mean reversion. Buy at Value Area Low, sell at Value Area High. The market rotates because nobody builds enough pressure to break out.
What doesn't work: Breakout trading. You wait for a break above a level, the break comes, moves 20 points, and then the market reverses. Classic breakout trap in low volatility.
Normal Volatility (VIX 15 to 22)
Characteristics:
- NQ daily ranges: 150 to 250 points
- Mix of range and trend days (~50/50)
- Volume Profile varies between D-shape and elongated shape
- Day type classification becomes critical
What works: Both, but you must correctly identify the day type. Range days: mean reversion. Trend days: pullbacks in trend direction. Identifying market phases is the decisive skill here.
What doesn't work: Stubbornly applying one strategy without considering the day type.
High Volatility (VIX Above 22)
Characteristics:
- NQ daily ranges: 250 to 450+ points (above 30: 500 to 1,000+)
- Trend days dominate (70%+)
- Volume Profile shows P or b shape (elongated, one direction dominates)
- VWAP has a clear slope
What works: Trend following. Pullbacks to VWAP or structural levels. Moves are large and direction is clear.
What doesn't work: Mean reversion becomes dangerous. The market blows through your Value Area, and your "reversion trade" becomes a trend fight that you lose. Five concrete rules for this regime are covered in our article on trading in high volatility.
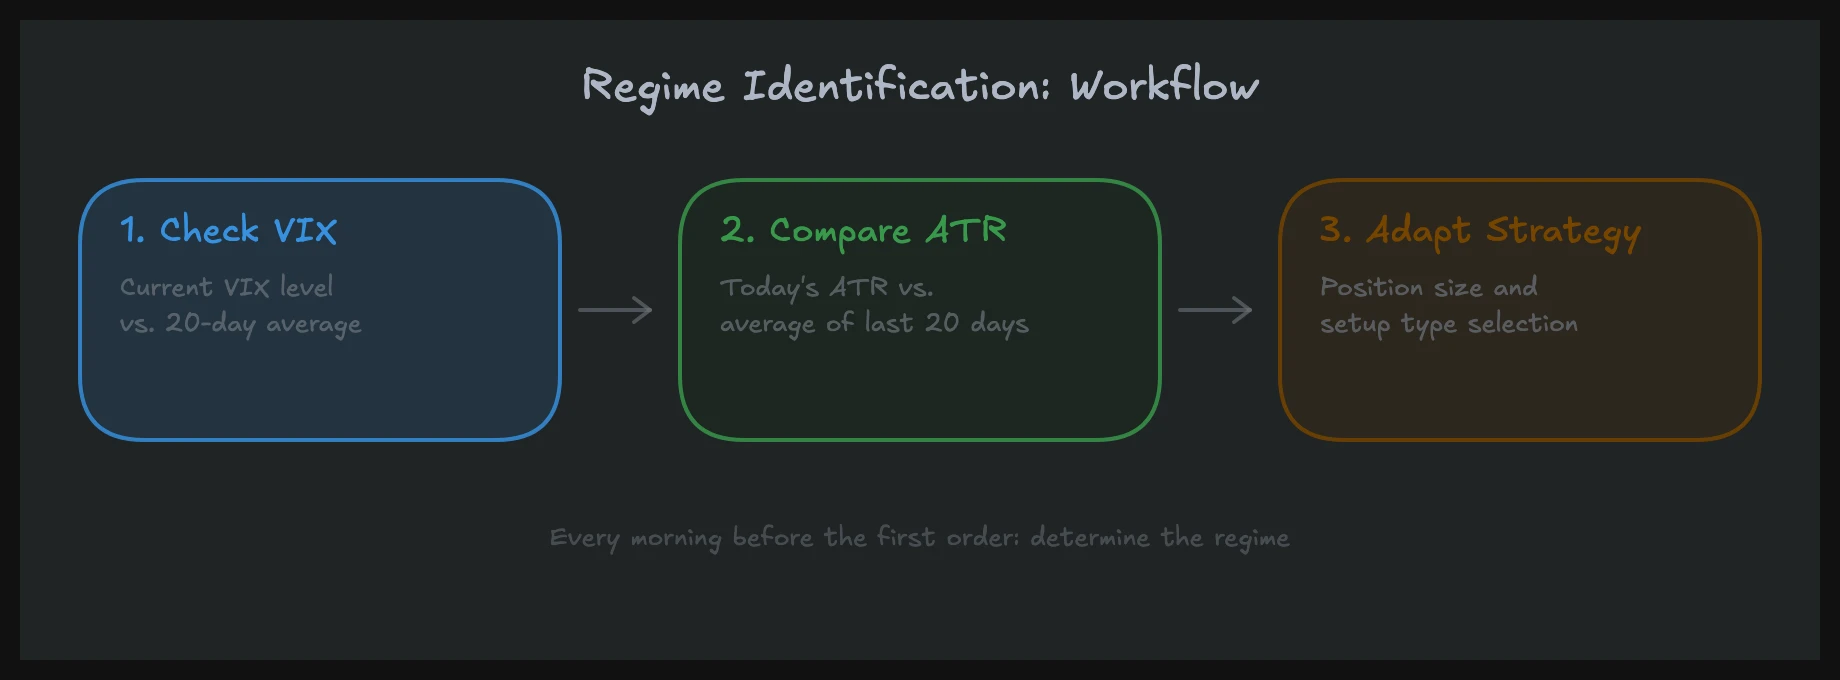
How to Identify the Regime BEFORE You Trade
Regime classification must happen before your first trade. Not after your third loss.
Step 1: Check the VIX
The fastest filter. VIX below 15 = low vol. VIX 15 to 22 = normal. VIX above 22 = high vol. This takes three seconds.
Step 2: Compare ATR
Compare the 14-day ATR with the 50-day ATR. If the short-term ATR sits significantly above the long-term (e.g., 14-ATR = 280, 50-ATR = 200), volatility is increasing. This is an early warning signal for a regime change.
Conversely: if the 14-ATR falls below the 50-ATR, the market is calming down. Range strategies become attractive again.
Step 3: Analyze the Last 5 Days
Look at the ranges of the last five trading days:
- Are ranges getting bigger? Volatility is rising.
- Getting smaller? Volatility is falling.
- Were 4 of 5 days trend days? You're in the high-vol regime.
- Were 4 of 5 days range days? You're in the low-vol regime.
Step 4: Classify Sunday, Confirm Monday
On Sunday, do your weekly analysis: VIX, ATR ratio, last week's action. Classify the likely regime. On Monday, confirm with actual price action from the first hour. Does the IB width match the expected regime? Is VWAP flat or sloping?
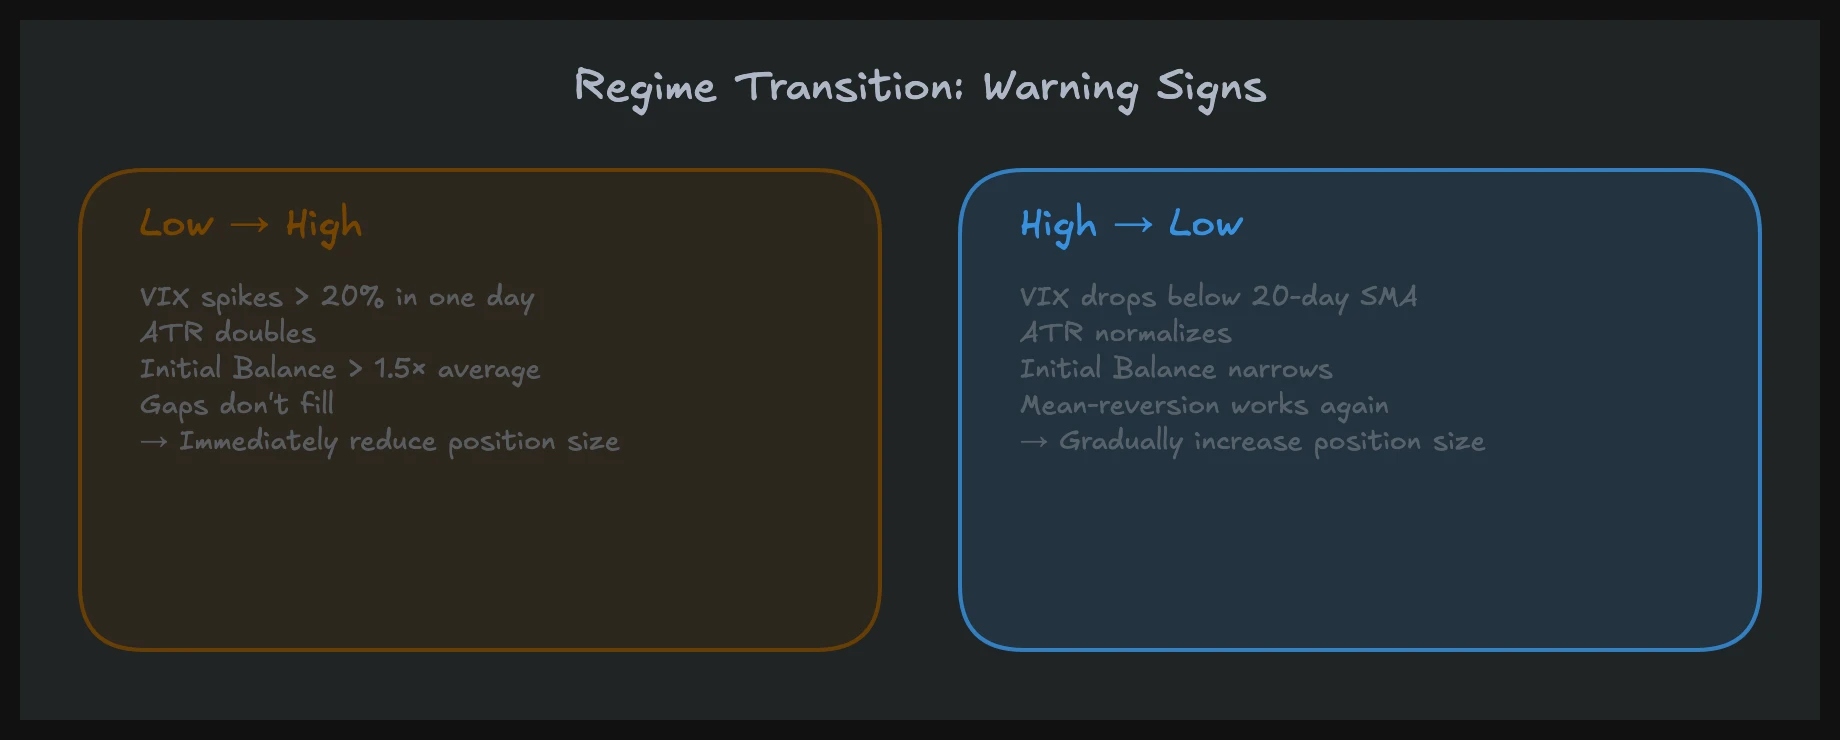
Regime Transitions: Where the Money Gets Lost
The most dangerous phases aren't the regimes themselves but the transitions between them. The market shifts from low vol to high vol, and traders who only know mean reversion suddenly start losing money.
Warning signs for a transition from low to high:
- VIX rises for three consecutive days, even if still below 22
- The 14-ATR crosses above the 50-ATR
- A range breakout holds for several hours, instead of immediately reverting
- The first hour produces an unusually wide range
When you see these signals, switch to "normal" mode immediately: smaller size, wider stops, more patience.
Conversely: when the VIX drops from 28 to 18 and ranges narrow, stop chasing trends. The market is back in range mode, and your breakout trades will become traps.
The Connection to the Bigger Picture
Volatility regimes don't exist in isolation. They're driven by macroeconomic forces: Fed policy, inflation, geopolitical events. Understanding the macro picture lets you anticipate regime changes.
In NQ trading, regime classification is especially important because NQ is inherently more volatile than ES. A VIX increase from 15 to 25 feels in NQ like going from 15 to 30, because tech stocks swing harder.
FAQ: Volatility Regimes
How often do regimes change?
Regimes are relatively stable and typically persist for weeks to months. A low-vol regime (VIX below 15) can last several months. High-vol phases (VIX above 25) average 4 to 8 weeks. The transition itself often happens quickly (1 to 3 days), especially from low to high. The shift from high to low is more gradual.
Can I use one strategy across all regimes?
No, and that's the point. A strategy that works across all regimes must be so diluted that it performs poorly in every single one. Better: 2 to 3 clearly defined approaches that you deploy based on the regime. Mean reversion for low vol, trend following for high vol, and the skill to classify day types for normal vol.
What if I misjudge the regime?
Your stop-loss catches that. That's why risk management matters so much. If you apply a mean reversion strategy in a trending regime, you lose, but your stop limits the damage. The realization comes after 2 to 3 consecutive losses: "Wait, am I in the wrong regime?" Then you adjust.
Regimes Are the Filter That Makes Everything Else Work
Most traders search for the perfect strategy. In reality, they need the right filter. The regime determines which strategy works. Without this filter, you're trading blind, sometimes hitting, sometimes missing, and never knowing why.
Make regime classification the first step of your daily workflow. Three minutes in the morning determine whether you work with the market all day or against it.
At United Daytraders, you learn these concepts in over 1,500 video lessons with real chart examples. The NQ Masterclass covers trend, range, and anomaly as separate modules because each regime requires its own approach.