VIX and Volatility in Trading: The Indicator Most Traders Misread
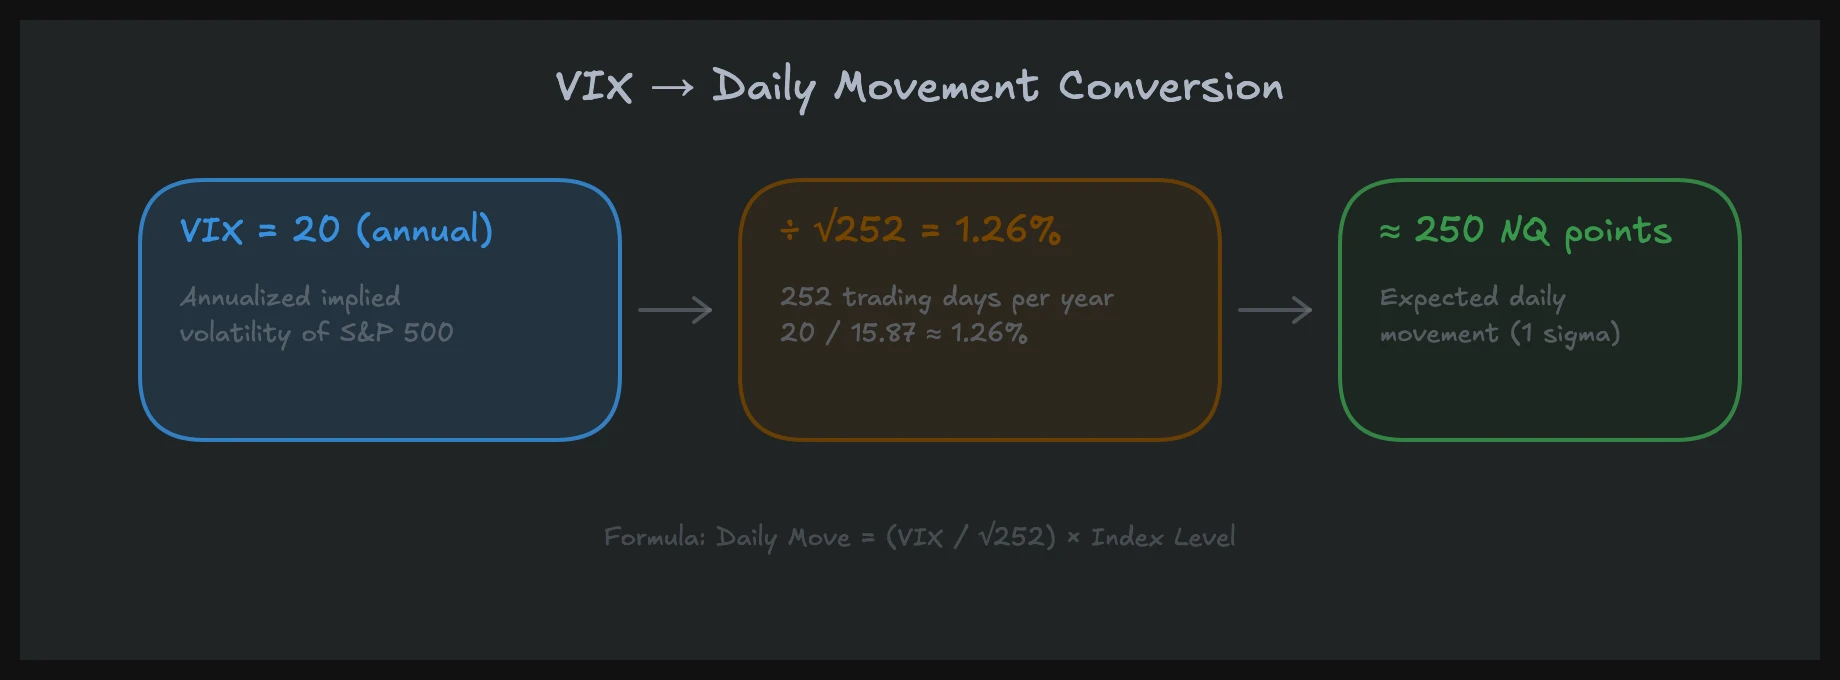
The VIX is the most quoted volatility indicator in the world, yet most traders misunderstand what it actually measures. VIX trading doesn't start with buying a product. It starts with understanding that the VIX represents the expected 30-day volatility of the S&P 500, calculated from SPX option prices. A VIX reading of 20 means the market expects daily swings of roughly 1.26% in the S&P 500.
Risk Disclaimer: Trading futures and other financial instruments involves significant risk of loss. Past results are not indicative of future performance. Only trade with capital you can afford to lose.
What the VIX Actually Measures (and What It Doesn't)
The VIX is commonly called the "fear index." That label is misleading. The VIX doesn't measure fear. It measures how much money market participants are willing to pay for options protection. When hedge funds and pension funds pay higher premiums for put options, the VIX rises. When they need less hedging, it falls.
The calculation uses a broad spectrum of SPX options across different strikes. The CBOE weighs these option prices and derives the implied volatility. The result is an annualized percentage.
Converting VIX to Daily Movement
To make the VIX practically useful, divide it by the square root of 252 (trading days per year), which is approximately 15.87:
- VIX 15: ~0.95% expected daily movement in S&P
- VIX 20: ~1.26% expected daily movement
- VIX 30: ~1.89% expected daily movement
- VIX 40: ~2.52% expected daily movement
For NQ (Nasdaq-100 Futures), actual volatility is typically 1.2 to 1.5 times greater than the S&P because tech stocks swing harder. A VIX of 25 means realistic NQ daily ranges of 250 to 400 points, compared to 80 to 150 points at VIX 15.
VIX vs. Realized Volatility
A common mistake: treating the VIX as a forecast of actual movement. The VIX measures expected volatility, not realized. Realized volatility (what actually happens) regularly deviates. Historically, the VIX overestimates actual movement by 2 to 4 points. This "volatility premium" exists because hedging costs money, and institutions willingly pay for it.
For your trading, this means: A VIX of 25 doesn't automatically mean the market will move 1.58% daily. It means the options market is pricing in that level of movement. The actual move is often less, though sometimes dramatically more.
VIX Term Structure: Contango and Backwardation
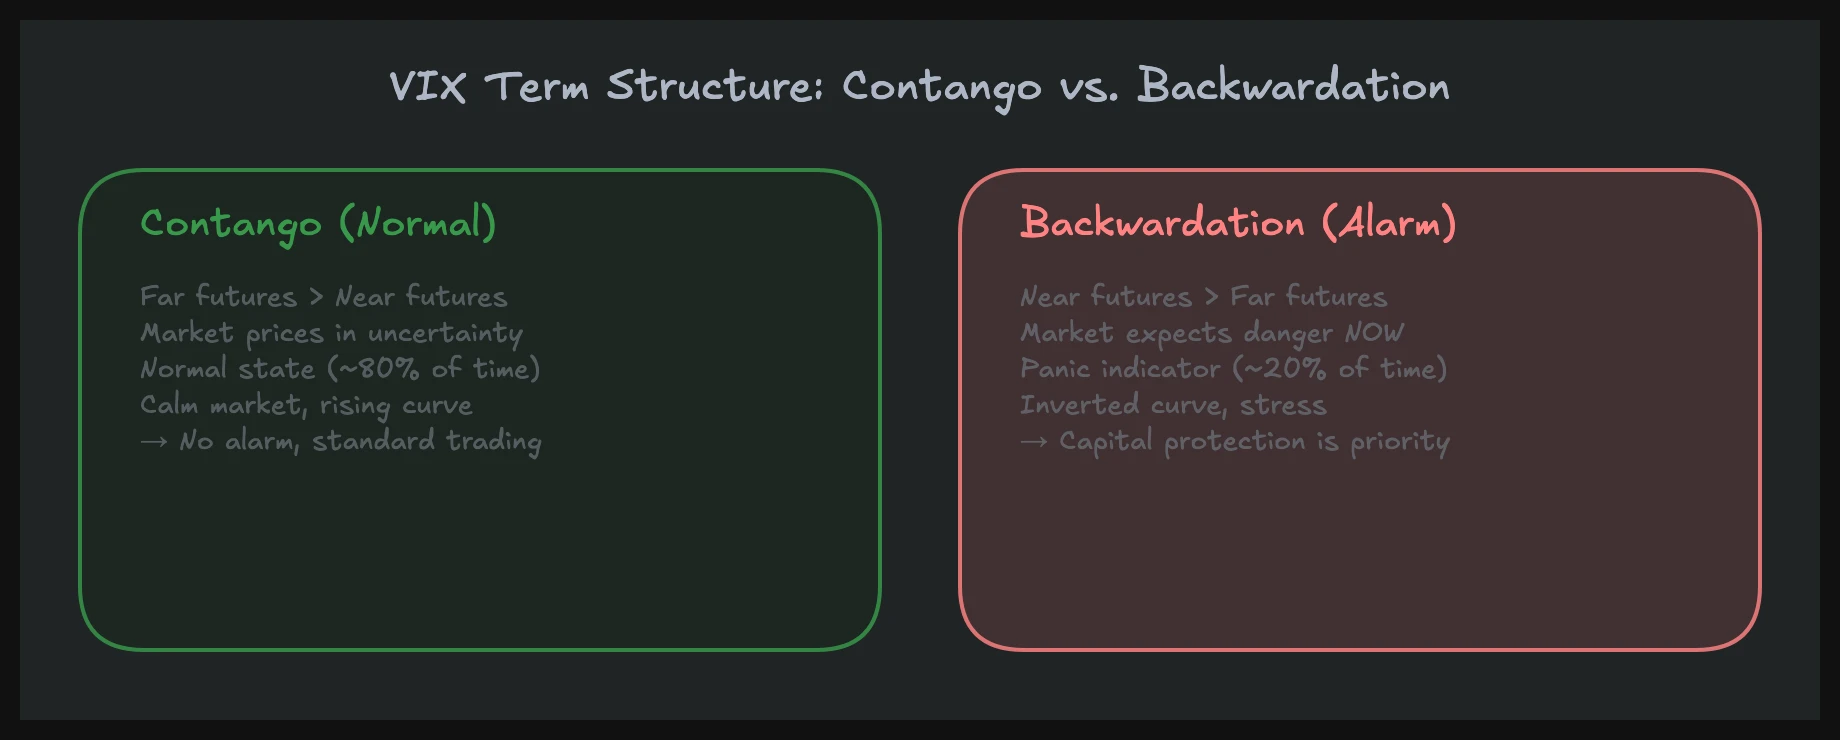
The VIX spot is only half the picture. The VIX futures curve (term structure) provides additional information. In normal conditions, longer-dated VIX futures trade above the spot (contango). This means: the market expects volatility to stay at current levels or increase slightly.
When the curve inverts (backwardation), meaning the spot trades above futures, that's an alarm signal. The market is experiencing MORE volatility NOW than it prices for the future. This typically happens during acute crises: the COVID crash in March 2020, the VIX explosion in February 2018, or during geopolitical shocks.
For NQ day traders: backwardation in the VIX means you need to prepare for sustained high volatility. Your position size and stop adjustments aren't temporary; they need to hold for days or weeks.
VIX Regimes: Four States, Four Approaches
When I traded at a prop desk, we didn't just "check the VIX." We classified the current volatility regime and adjusted our entire approach accordingly. The same strategy that consistently makes money at VIX 14 can destroy your account at VIX 35.
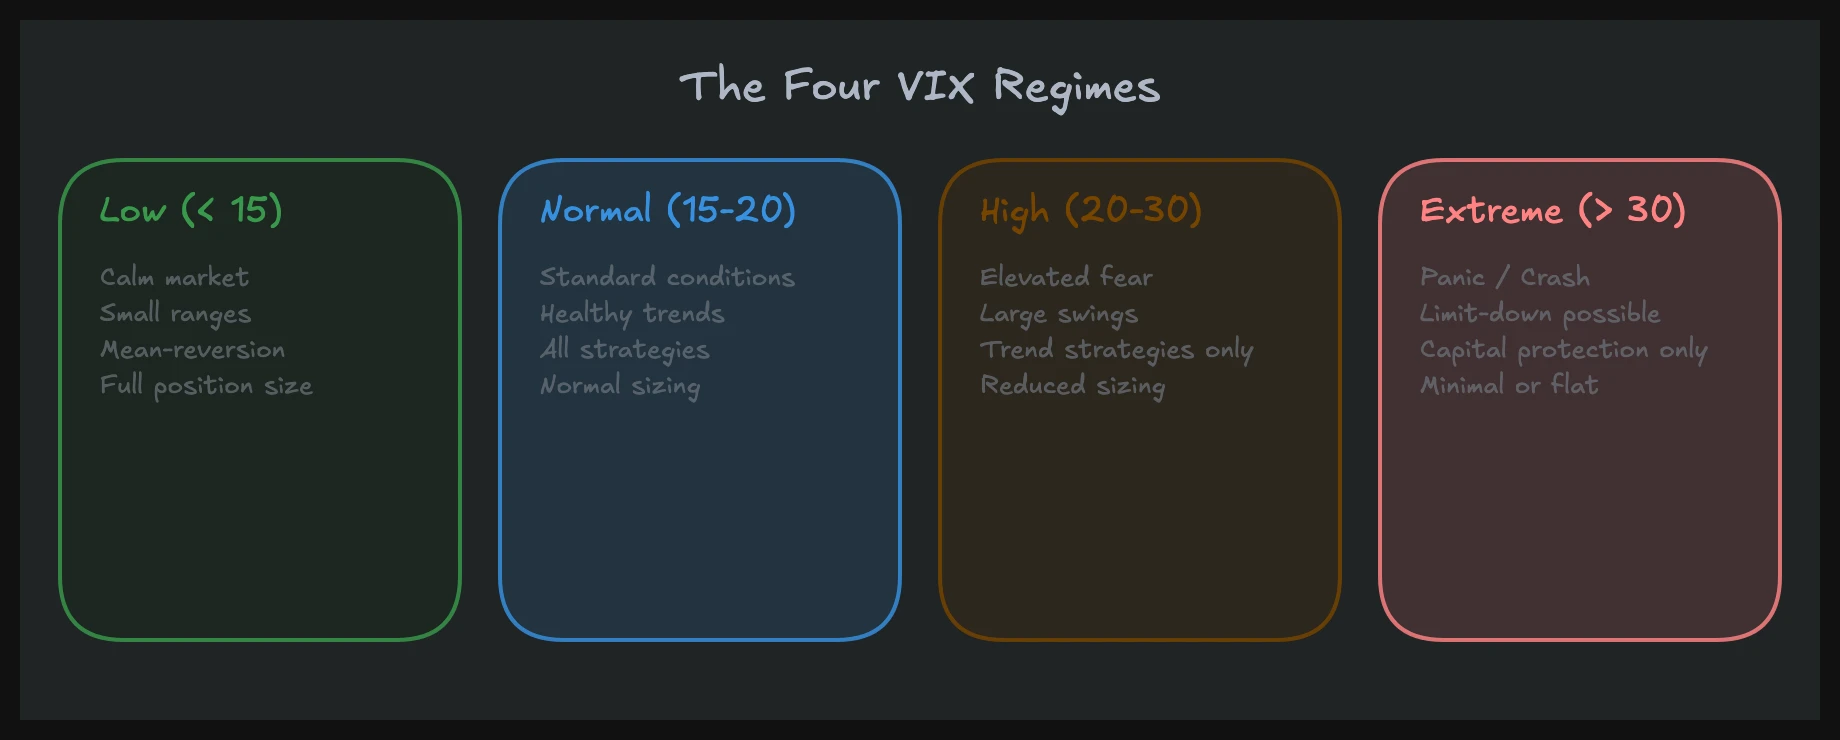
Low Volatility (VIX Below 15): Mean Reversion Territory
When the VIX sits below 15, NQ ranges are tight (80 to 150 points per day). The market oscillates between Value Area High and Low. VWAP is relatively flat. Trend days are rare.
This is paradise for mean reversion strategies. Buy at Value Area Low, sell at Value Area High, and the market cooperates because nobody is pushing hard enough to break out. The Volume Profile shows the classic D-shape in this phase: volume concentrated in the middle, thin tails.
The danger: traders get comfortable with tight stops and small targets. When volatility suddenly spikes, they're unprepared mentally and technically.
Normal Volatility (VIX 15 to 22): Mixed Mode
The default state. Trend and range days alternate. NQ ranges run 150 to 250 points daily. Most strategies work here, provided you correctly identify the day type.
The ability to identify market phases becomes particularly important in this regime. You trade a range day differently from a trend day. Classifying the day type before trading determines your success.
Elevated Volatility (VIX 22 to 30): Trend Mode
Ranges widen significantly (250 to 450+ points in NQ). Trend days dominate. Mean reversion works poorly because the market favors one direction. VWAP shows a clear slope.
For experienced traders, these are the most profitable phases: moves are large, direction is clear, and order flow signals like absorptions and exhaustions become clearly visible in Footprint Charts because volume spikes are larger.
The rule: stop fading. Look for pullbacks in the trend direction.
Extreme Volatility (VIX Above 30): Anomaly Days
VIX above 30 means the market is in an exceptional state. NQ daily ranges of 500 to 1,000+ points become possible. Gaps, limit-down moves, and massive reversals within minutes. These are the days when accounts die.
For most traders: reduce position size by at least 50%, or stay flat entirely. Anomaly days aren't for trading, they're for surviving. Our risk management guide explains why capital preservation takes priority on these days.
For detailed rules on trading extreme volatility, read our article on trading in high volatility.
Why the Regime Matters More Than the Indicator
The key point: this isn't about "trading" the VIX as an indicator. It's about adjusting your entire behavior to the current regime. This affects:
- Strategy selection: Mean reversion in low vol, trend following in high vol
- Position sizing: Automatically scaled with ATR
- Stop distance: Structure-based, not fixed
- Day planning: Range expectations and level selection
- Mental approach: Patience in low vol, discipline in high vol
Treating the VIX as an isolated indicator ("VIX above 20, so go short") misses the point entirely. The VIX is a context provider, not a signal generator. It doesn't tell you what to trade. It tells you how.
Adjusting Position Size to Volatility
This is where retail separates from institutional. On a professional desk, position size adjusts to current volatility automatically. No discussion, no "I feel brave today." The formula is simple:
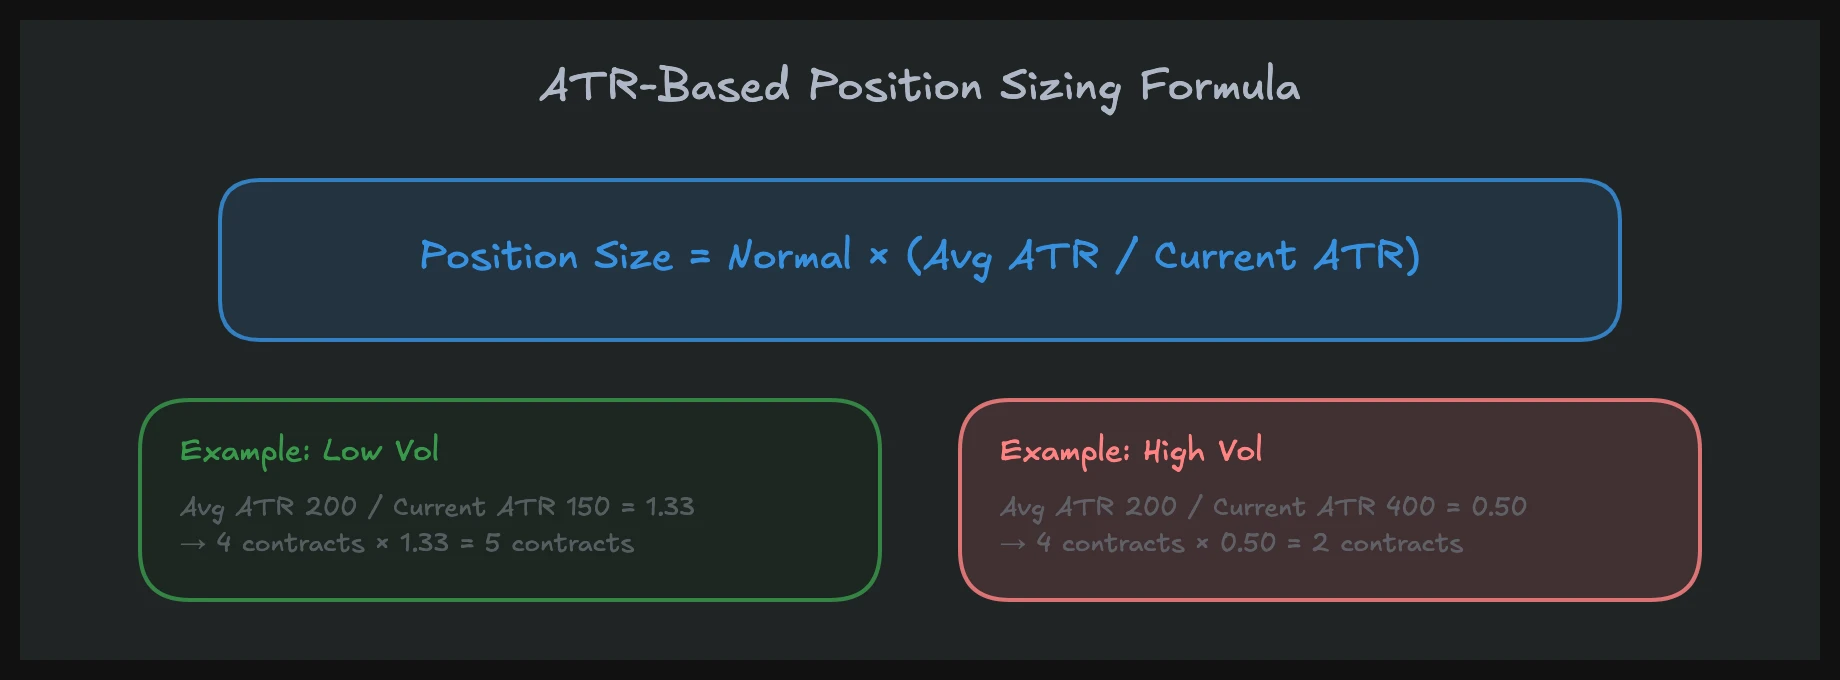
Adjusted Size = Normal Size x (Average ATR / Current ATR)
An example: your normal NQ position is 2 contracts, based on an average ATR (14-day) of 200 points. Today the ATR reads 350 points.
Adjusted Size = 2 x (200 / 350) = 1.14, so 1 contract.
The ATR is nearly double, so you halve your size. No negotiating, no gut feeling. Math.
Why Retail Traders Don't Do This
Retail traders almost always trade fixed position sizes. 2 contracts at VIX 12, 2 contracts at VIX 35. That's like planning the same braking distance at 30 mph and 120 mph. Physics doesn't forgive it, and neither does the market.
During my institutional career, the risk system was automated. When volatility exceeded a threshold, limits were automatically reduced. Not because the trader was bad, but because higher volatility at the same size mathematically means more risk.
Stop-Loss Across VIX Regimes
Your stop distance must move with volatility. A 15-point NQ stop makes sense at VIX 14 (two to three ATR multiples). At VIX 30, a 15-point stop is noise. You get stopped out before the trade can work.
The solution: base stop distance on current ATR or market structure (previous high/low, VWAP, Value Area boundary). In higher volatility, structural levels are farther apart, so stops must be wider, and position size correspondingly smaller.
VVIX: The VIX of the VIX
The VVIX measures the volatility of the VIX itself. It tells you how uncertain the market is about future volatility. If the VIX sits at 20 and the VVIX at 80, the market expects no big changes. If the VIX is at 20 and the VVIX at 140, a sharp VIX move is likely.
For day traders, the VVIX is an early warning system. A suddenly rising VVIX with a still-stable VIX suggests the options market is pricing in a shift that's not yet visible in the VIX itself. That gives you a time advantage.
VVIX Thresholds in Practice
- VVIX below 90: Stable environment, VIX likely to stay rangebound
- VVIX 90 to 110: Normal range, moderate uncertainty
- VVIX above 110: Elevated tension, VIX breakout probable
- VVIX above 140: Extreme state, major VIX move imminent
You don't trade the VVIX directly. You use it as a filter: when the VVIX is high, prepare for volatility expansion. Reduce sizes, widen stops, or wait.
2026: Volatility in the Tariff Era
Since the Trump tariffs in early 2026, the volatility regime has fundamentally shifted. The VIX consistently moves between 18 and 30, instead of the 12 to 18 range from 2023 and 2024. For traders, this means: the rules from the low-volatility era no longer apply.
Trade policy uncertainty creates a particular kind of volatility: unannounced, abrupt shocks. A tweet, a press conference, an unexpected tariff announcement, and NQ moves 200 points in 10 minutes. This isn't normal market volatility. It's political volatility that can't be predicted with historical models.
What This Means for You
- Daily VIX classification is mandatory. Not once a week. Every morning.
- Position sizes need to be smaller than in previous years because baseline volatility is higher.
- Mean reversion works less often. Trend days have become more frequent.
- Daily loss limits are not optional. They're survival equipment.
How different volatility regimes determine your strategy selection is covered in detail in our article on volatility regimes.
Integrating VIX Analysis into Your Workflow
Adding the VIX to your daily workflow isn't rocket science. It takes five minutes before trading:
- Check VIX level: Where are we? Below 15, 15 to 22, 22 to 30, above 30?
- VIX trend: Has the VIX been rising for days, or falling? Rising trend = caution.
- Check VVIX: Above 110? Prepare for surprises.
- Compare ATR: 14-day ATR vs. 50-day ATR. If the short-term ATR exceeds the long-term, volatility is increasing.
- Adjust position size: Apply the formula before entering any trade.
This sounds simple, and it is. Yet most retail traders don't do it. They might check the VIX but don't adjust their behavior. That's like reading the weather forecast and walking into a blizzard in a t-shirt.
VIX Journal: An Underrated Tool
A tip that sounds simple yet proves incredibly valuable: keep a VIX journal. Every day, note the VIX level, ATR, your regime classification, and the actual daily range. After 30 days, you'll recognize patterns that were previously invisible to you.
For instance, you might see: "At VIX 18 to 20 with a rising tendency, I lose disproportionately because I'm still in range mode while the market is already shifting to trend mode." You don't get these insights from theory. You get them from systematic observation. The VIX should have a permanent column in your trading journal.
On institutional desks, automated reports handle this. As a retail trader, you are your own risk management system. A VIX journal is a step toward professional self-discipline.
Volatility and NQ: Why Nasdaq Traders Need the VIX
NQ (Nasdaq-100 Futures) is inherently the more volatile instrument compared to ES (S&P 500 Futures). This is structural: the Nasdaq-100 is tech-heavy, and tech stocks react more strongly to rate speculation, growth expectations, and sentiment shifts.
In practice, this means: when the VIX rises by 5 points, it feels like a 7 to 8 point increase in NQ. Ranges widen disproportionately, sweeps get faster, and reversals sharper.
A concrete example from 2026: the day after the second round of tariffs, the VIX jumped from 22 to 31. ES lost 2.8%. NQ lost 4.1%. The NQ daily range exceeded 600 points. Traders running normal NQ size experienced P&L swings three times above their usual level.
The lesson: for NQ traders, the VIX is not optional. It's the first number you check in the morning, before looking at a chart.
The Connection Between Volatility and Macroeconomics
Volatility doesn't appear in a vacuum. It results from macroeconomic forces: Fed rate decisions, inflation data, employment reports, geopolitical events. Traders who understand macroeconomics can anticipate phases of elevated volatility instead of just reacting.
An FOMC meeting is approaching? The VIX typically rises 3 to 5 days beforehand. CPI data is being released? Implied volatility in short-term options explodes. Knowing these patterns means being prepared.
Trading psychology plays a particularly large role during volatile phases. Higher volatility means larger P&L swings, and that strains decision-making. Many traders make their worst decisions exactly when volatility is highest, because fear and greed both escalate.
Scheduled Events vs. Unplanned Shocks
There are two categories of volatility drivers, and they require different preparation:
Scheduled events (FOMC, CPI, NFP, ECB) are visible in the economic calendar. The VIX typically rises 3 to 5 days before an FOMC meeting and drops afterward ("volatility crush"). These patterns are predictable. You know when to be cautious.
Unplanned shocks (tariff announcements, geopolitical escalations, banking crises) come without warning. No calendar helps here. What helps: a fundamentally defensive position. Anyone who never risks more than 1 to 2% of their account per trade and has a daily loss limit survives unplanned shocks too.
The difference: with scheduled events, you can reduce exposure beforehand. With unplanned events, only the risk management you already implemented saves you. Both together form a complete shield.
FAQ: VIX and Volatility in Trading
What does a high VIX mean?
A high VIX (above 25) means the options market is pricing in high S&P 500 swings over the next 30 days. For day traders, this means: larger daily ranges, faster moves, and more trend days. It's not a buy or sell signal but a signal to adjust your approach: smaller positions, wider stops, focus on trends rather than mean reversion.
Should I trade when the VIX is high?
That depends on your experience. Experienced traders can profit from high volatility because the moves are larger and order flow signals are clearer. Beginners should drastically reduce size at VIX above 30 or pause entirely. The five rules for this are covered in our article on trading in high volatility.
How do I adjust position size to volatility?
The simplest method: normal size multiplied by the ratio of average ATR to current ATR. If your average ATR is 200 points and the current ATR is 300, you trade two-thirds of your normal size. This adjustment ensures your dollar risk per trade stays constant regardless of market movement.
What's the difference between VIX and ATR?
The VIX measures expected future volatility, derived from option prices. ATR (Average True Range) measures past realized volatility based on actual price movements. Both complement each other: the VIX tells you what the market expects. ATR tells you what actually happened. Use ATR for position sizing calculations. Use the VIX for regime classification.
Can I trade the VIX directly?
You can't trade the VIX index directly. You can trade VIX futures (/VX) and VIX options, but these instruments are complex with their own dynamics (contango, backwardation, term structure). VIX futures behave differently from the VIX spot index. For most day traders, the VIX is an analysis tool, not a trading instrument.
Understanding VIX Is Not Optional
Volatility is not a danger to avoid. It's the market property that makes making money possible in the first place. Without volatility there is no movement, and without movement there is no profit. The question isn't whether you deal with volatility, but how.
Most retail traders ignore the VIX and trade every day with the same setup and the same size. This works in quiet phases and blows up in volatile ones. The solution isn't complicated: check the VIX, classify the regime, adjust size, adapt stops. Five minutes in the morning that can save your account.
At United Daytraders, you learn these concepts in over 1,500 video lessons with real chart examples. The NQ Masterclass dedicates an entire lesson to volatility because it's not a side topic but the foundation of every trading decision.