3 Nasdaq Trading Strategies Used by Institutional Traders
The Nasdaq-100 Future moves on average about five times as much per day as the S&P 500. This volatility makes NQ the preferred instrument for institutional day traders. Three Nasdaq trading strategies they use again and again: VWAP Reversion, Failed Structure, and Exhaustion at Key Levels. The principle behind all three is identical: first the framework, then the timing.
Risk Disclaimer: Trading futures and other financial instruments carries substantial risk of loss. Past results are not indicative of future performance. Only use capital you can afford to lose.
These aren't "buy when X crosses above Y" recipes. They're frameworks. Each of these strategies requires two steps: first establish a structural thesis, then find the timing via order flow. This separation of analysis and execution distinguishes institutional trading from what most retail traders do. You need a direction first, then a timing tool. Not the other way around.
Strategy 1: VWAP Reversion
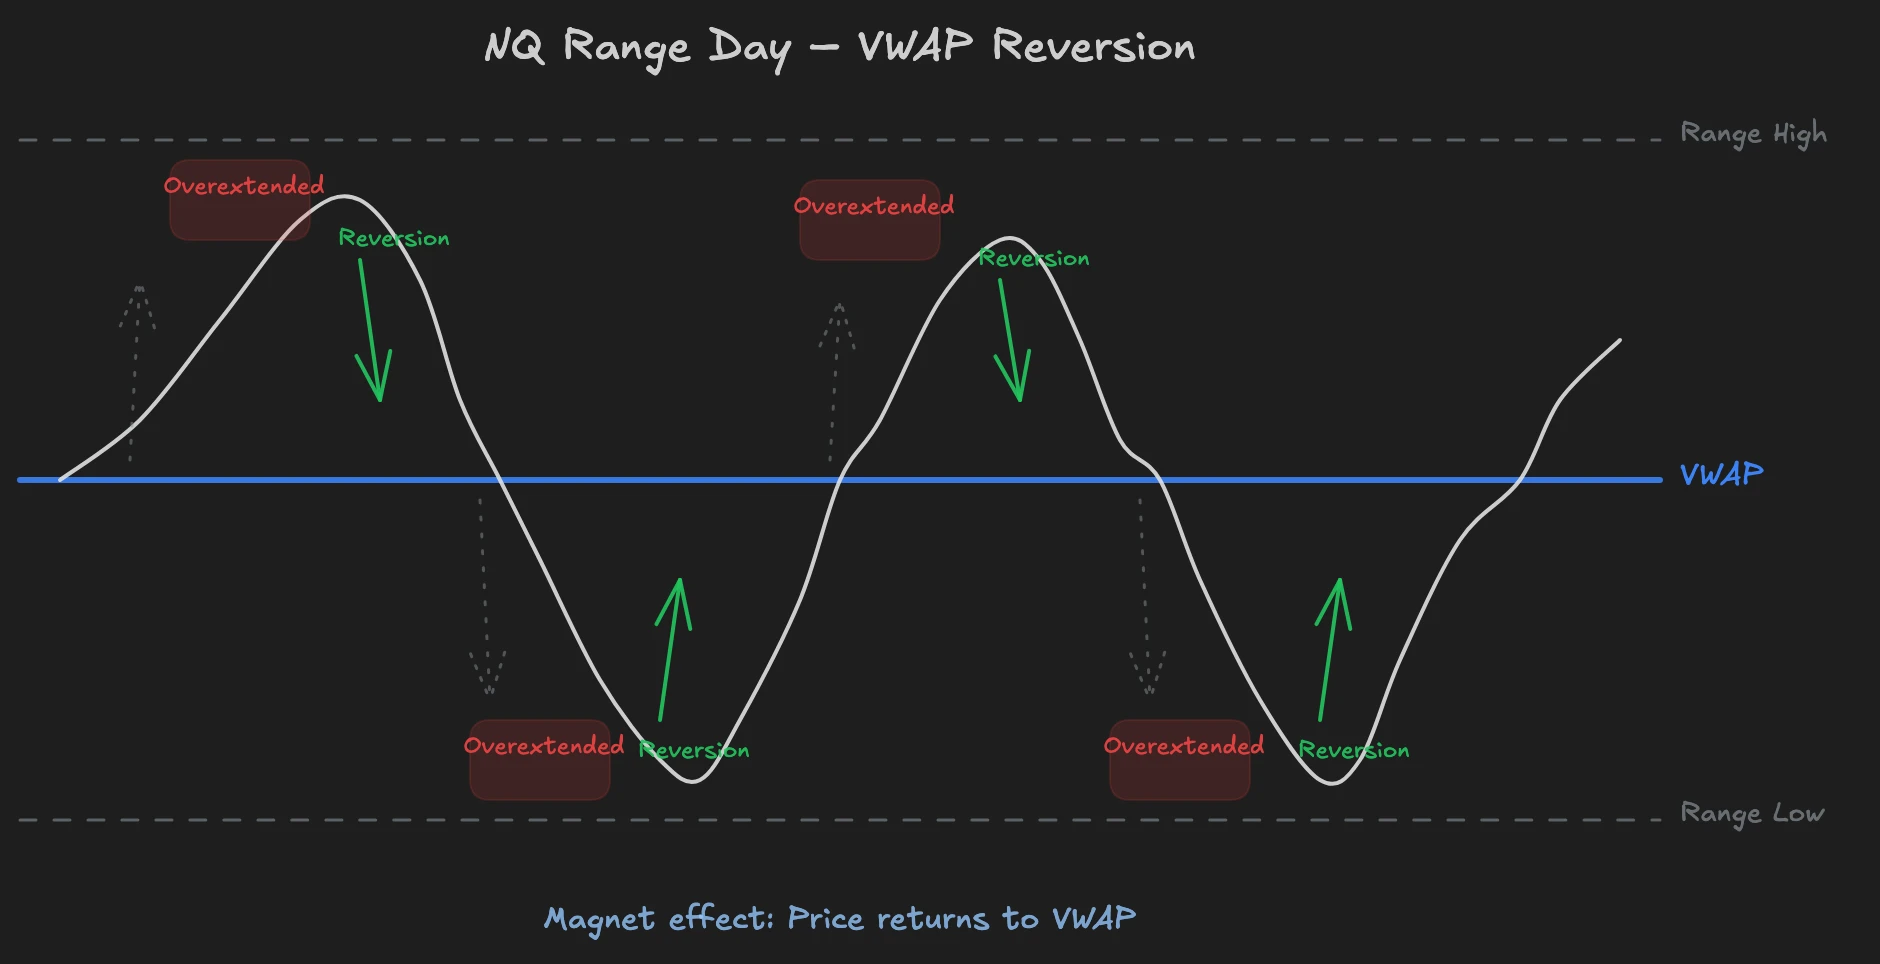
VWAP (Volume Weighted Average Price) shows where actual trading volume lies. Not where the price was, but where trading really happened. When the price is far from VWAP, it's "expensive" or "cheap" from an institutional perspective. Algorithmic systems are programmed to trade the price back to VWAP. This creates a natural magnet effect.
When VWAP Reversion Works
About 70% of trading days are range days. The market moves sideways without establishing a clear trend. Exactly in these phases, VWAP reversion works best: the price moves away from VWAP, finds no follow-up buyers or sellers, and gets pulled back to the average. That's why VWAP reversion is also the foundation for most Nasdaq scalping setups, where you capture small, fast moves near the mean.
The logic is simple: above VWAP you have a long bias, below VWAP a short bias. But here lies the crucial point many overlook: you trade NEAR VWAP, not far away from it. Anyone who enters only when the price is already 50 points above VWAP has the worst risk-reward ratio. Institutions trade where the price is close to VWAP because that's exactly where the probability of a reaction is highest.
Three VWAPs, Three Reversion Levels
In NQ, I work with three VWAPs: the daily VWAP, the EU-session VWAP, and the US-session VWAP. Each represents its own trading period and creates its own reversion level. The daily VWAP runs all day but only becomes truly meaningful once US volume comes in. The EU VWAP shows you what European traders did before the US open. And the US VWAP is often even more important for the American session than the daily one.
Sometimes you wonder why the price doesn't react at the daily VWAP. Switch on the US VWAP and you see the reaction immediately. Three VWAPs mean three independent reference points. If two or all three lie at a similar level, that increases the reversion probability.
What Can Go Wrong
On trend days, VWAP reversion becomes a losing proposition. When real demand or real supply drives the market, VWAP simply gets dragged along. The price doesn't come back. That's why it's mandatory to check the economic calendar beforehand. Macro data like Fed decisions or NFP numbers can shift sentiment so strongly that reversion doesn't work all day. The order flow shows you whether the market orders pushing the price away from VWAP are slowing down or not. If they slow down, reversion is likely. If they stay aggressive, stay out.
Strategy 2: Failed Structure
"What should have normally happened here? And why didn't it happen?" That's the central question behind Failed Structure. When something should happen and doesn't, market participants are trapped on the wrong side. Their forced exits drive the price in the opposite direction. That's exactly where the trade lies.
Failed Structure in a Trend
A new high is formed. Normally, continuation should come now. Breakout traders enter, momentum attracts more buyers. But none of that happens. The price turns and breaks the last swing low. The longs who bought at the high are trapped. Their stop-loss orders become market sell orders that push the price down even faster. This is classic Failed Structure: the expectation was continuation, the reality is reversal.
Failed Structure in a Range
Price breaks out of the range to the upside. Breakout traders jump in because "the breakout is there." But the price immediately returns to the range. The breakout buyers are stuck. Their exits drive the price not just back to the range middle, but often to the range low. These are directly related to stop runs: the released liquidity after the failed breakout is the fuel for the move in the opposite direction.
Failed Order Flow
The same logic works at the order flow level. Aggressive buy orders flood the market, but the price doesn't move. The volume is there, the aggression is there, but the result is absent. This means: the other side is absorbing everything. When the aggression slows down, suddenly the buyer is missing and the other side takes over.
Why Especially NQ?
NQ is a sentiment-driven market. Expectations form quickly and fail quickly. An earnings surprise from Apple, a hawkish Fed statement, an Nvidia downgrade. Each of these events creates an expectation. When this expectation isn't confirmed, trapped participants turn their positions. And because NQ is so volatile, the resulting moves are larger than in any other index future.
The Entry
The entry for Failed Structure lies as close as possible to the point of failure. Not after confirmation, when the price has already run 30 points in your direction. But right at the "make it or break it" point. This creates the best risk-reward ratio because your stop can lie directly above the failure point. If the thesis is wrong, you're out quickly. If it's right, you have the entire move ahead of you.
This is also the reason most retail traders can't trade Failed Structure: they wait for confirmation. But confirmation only comes when the price has already run 20 or 30 points. Then R:R is destroyed. Professional traders enter where it hurts. Where uncertainty is greatest. That's exactly where the risk-reward ratio is best.
Strategy 3: Exhaustion at Key Levels
Exhaustion isn't the same as absorption. That's an important distinction many traders don't make. With absorption, aggressive market orders are there, but they're being absorbed by the other side. This is risky to trade because you're standing against real aggression. Exhaustion is the opposite: market orders aren't there anymore. The aggression has dried up. No threat, no pressure. The engine has no fuel left.
Where You Should Watch for Exhaustion
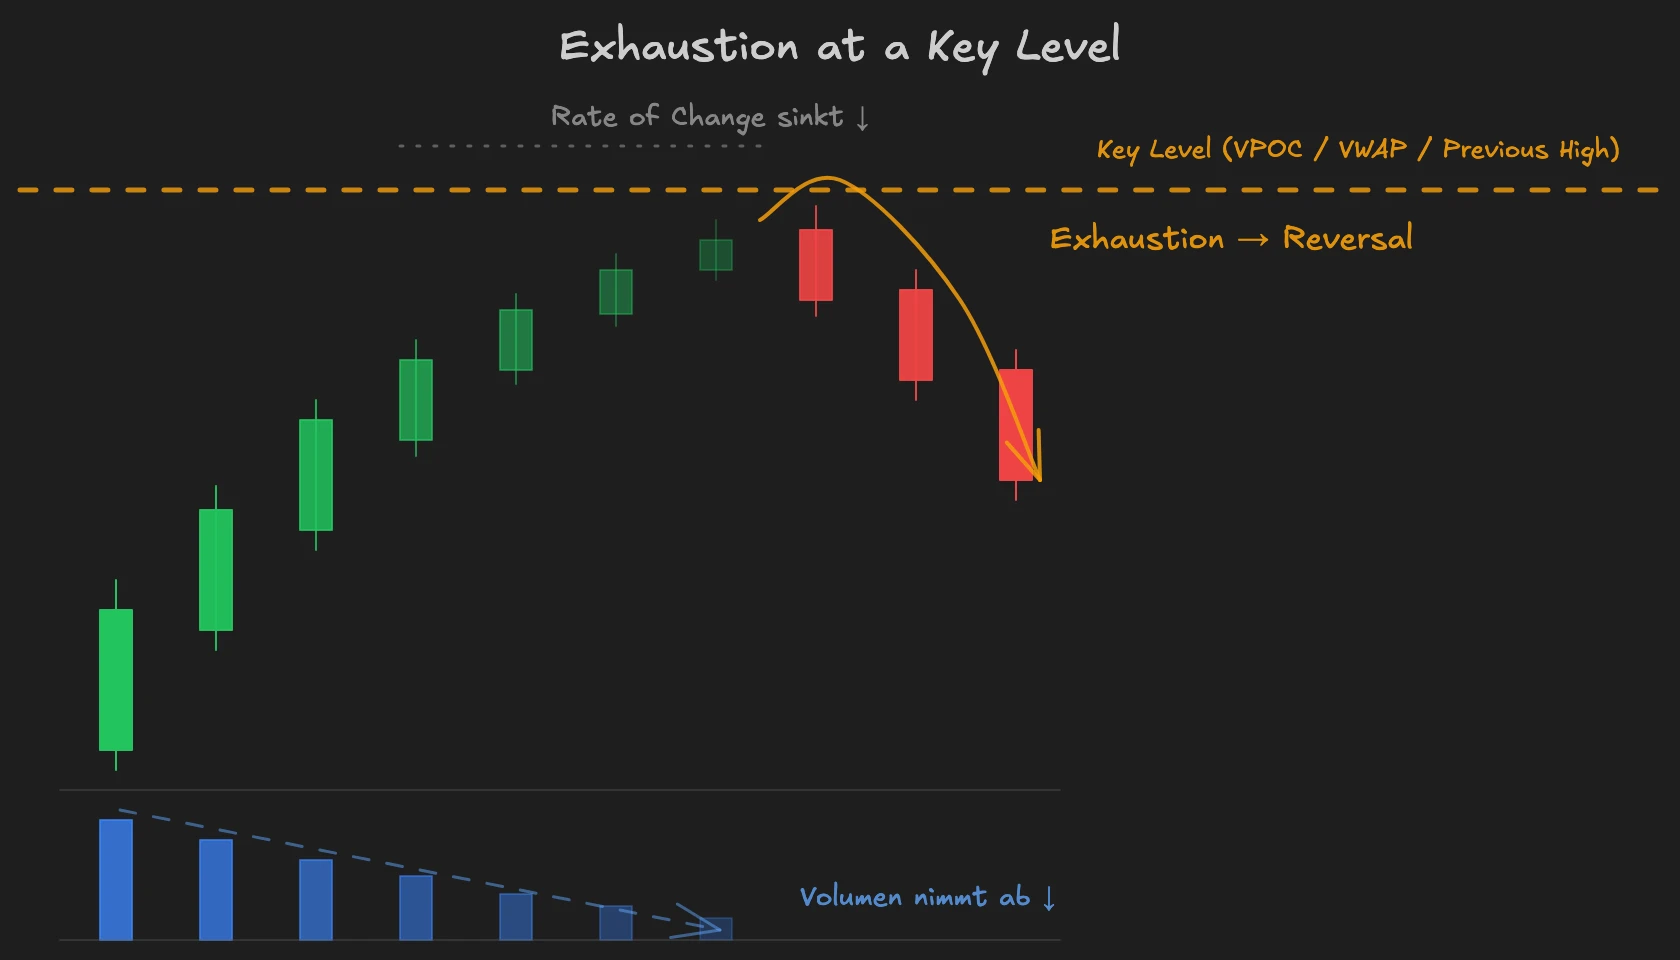
Key levels where exhaustion is particularly meaningful: Volume Profile nodes, VWAP levels, range highs and lows, previous day high and low, settlement price. At these levels, institutional traders watch whether the market has the strength to break through. If not, that's a signal.
What Exhaustion Looks Like
You see it in small order sizes, falling volume, and a price that barely ticks anymore. The market moves toward a level, but with less and less energy. The rate of change slows down. A real breakout has high rate of change: fast, aggressive, with volume. An exhausted move has the opposite: slow, thin, without conviction.
In the footprint chart and with big trades, exhaustion becomes directly visible. On a normal candlestick chart, you only see the candle. You don't see whether 5,000 contracts or 500 contracts are behind the move. You don't see whether order sizes are falling. Without this internal volume information, you remain blind to exhaustion.
The Highest Confluence
The strongest setup emerges when Failed Structure and exhaustion come together. The price breaks a level, but market orders aren't there to carry the move. Failed Structure delivers the thesis: "This breakout will fail." Exhaustion delivers the confirmation: "The aggression has already dried up." When both come together, you have the highest conviction for a reversal.
The Unifying Principle
All three strategies follow the same pattern: first the structural thesis, then the order flow confirmation. This isn't coincidence. It's the basic principle behind professional NQ trading. This distinguishes institutional NQ trading from retail approaches that use order flow as a primary signal instead of as confirmation. Those who understand this separation have a clear advantage in every market phase.
Order flow should confirm, not lead. You need a direction first. An idea of what the market should structurally do. Then you use order flow as a timing tool to find the right moment for entry. Those who only look at order flow without a structural framework see "signals" everywhere that lead nowhere. This sequence applies in every market phase: in a trend, you need the structural direction before you watch for continuation order flow. In a range, you define the boundaries first before you read exhaustion or absorption. And with anomalies (macro data, earnings), context determines the thesis, not order flow.
Professional NQ traders read the market phase and choose the matching strategy. Range day? VWAP reversion. Turning point after a failed breakout? Failed Structure. Price at a key level without energy? Exhaustion.
The skill doesn't lie in memorizing three setups. It lies in reading context and choosing the right strategy for the current situation. This sounds simple, but that's exactly where most fail. Anyone who trades VWAP reversion on a trend day loses. Anyone who looks for Failed Structure in a calm range market finds nothing. The strategy must match the phase. And that can't be packed into an algorithm. It requires screen time, practice, and an understanding of market mechanics.
FAQ: Nasdaq Trading Strategies
Can I Apply These Strategies Without Order Flow Tools?
Partially. VWAP reversion and Failed Structure can fundamentally be recognized on a candlestick chart too. You see price at VWAP, you see failed breakouts. But exhaustion is practically invisible without order flow tools. You need at least a footprint chart or professional order flow software to see the internal volume changes.
Which Strategy Should I Learn First?
VWAP reversion. As a day trading strategy, it's the most accessible because the framework is clearest: price above or below VWAP, range market yes or no. The most common regime (ranges on about 70% of days) plays into your hands, and interpretation requires the least experience. Failed Structure and exhaustion demand more screen time until you can reliably recognize the patterns.
Do These Strategies Work on MNQ Too?
Yes, identically. Micro Futures (MNQ) trade at the same exchange as NQ, with the same data and the same patterns. The only difference is the point value: $2 instead of $20 per point. Market structure, order flows, and strategies are exactly the same.
In our mentoring program, you'll learn these concepts in over 1,500 video lessons with real chart examples. The NQ Masterclass devotes its own lessons to each of these strategies: VWAP logics, Failed Structure, absorptions, and exhaustions.