Supply and Demand Zones: Confirming with Volume Analysis
Supply and demand zones are price areas where institutional traders have placed aggressive buy or sell orders. Without volume confirmation, every swing point becomes a potential zone, and you are guessing. With Volume Profile and order flow analysis, you can objectively filter which zones show genuine institutional accumulation.
Risk Disclaimer: Trading futures and other financial instruments involves significant risk of loss. Past results are not indicative of future performance. Only trade with capital you can afford to lose.
What Supply and Demand Zones Actually Represent
Supply and demand zones are price areas where demand overwhelmed supply (demand zone) or supply overwhelmed demand (supply zone). Put differently, they are the locations where institutional traders built or liquidated positions. This is not opinion. This is market mechanics.
When I worked as an institutional trader, I never looked for "zones" on a chart. I looked for volume. Where did volume concentrate? Where did the market rotate for an extended period? Where did market makers provide liquidity? The answers to these questions reveal real supply and demand zones, not the drawn boxes from YouTube tutorials.
The Principle Behind Supply and Demand
The futures market is an auction. Auction Market Theory describes how prices emerge through the interaction of buyers and sellers. When price drops into an area where institutions want to buy, demand appears. Price reverses. When price rallies into an area where institutions want to sell, supply appears. Price reverses again.
The problem: on a naked chart, every reversal looks the same. Every swing point could be a supply or demand zone. Without a way to distinguish real institutional activity from random reversals, you draw rectangles on your chart and hope.
Why "Zone" and Not "Level"
A single price is not enough. Institutions cannot execute their entire position on a single tick. They need depth. An institution buying 5,000 contracts in Nasdaq futures spreads that order across a price range. This creates a zone, not a single price. That is why the Volume Profile shows wide volume bulges at genuine supply and demand areas, not isolated spikes.
The Problem with Price-Only Supply and Demand
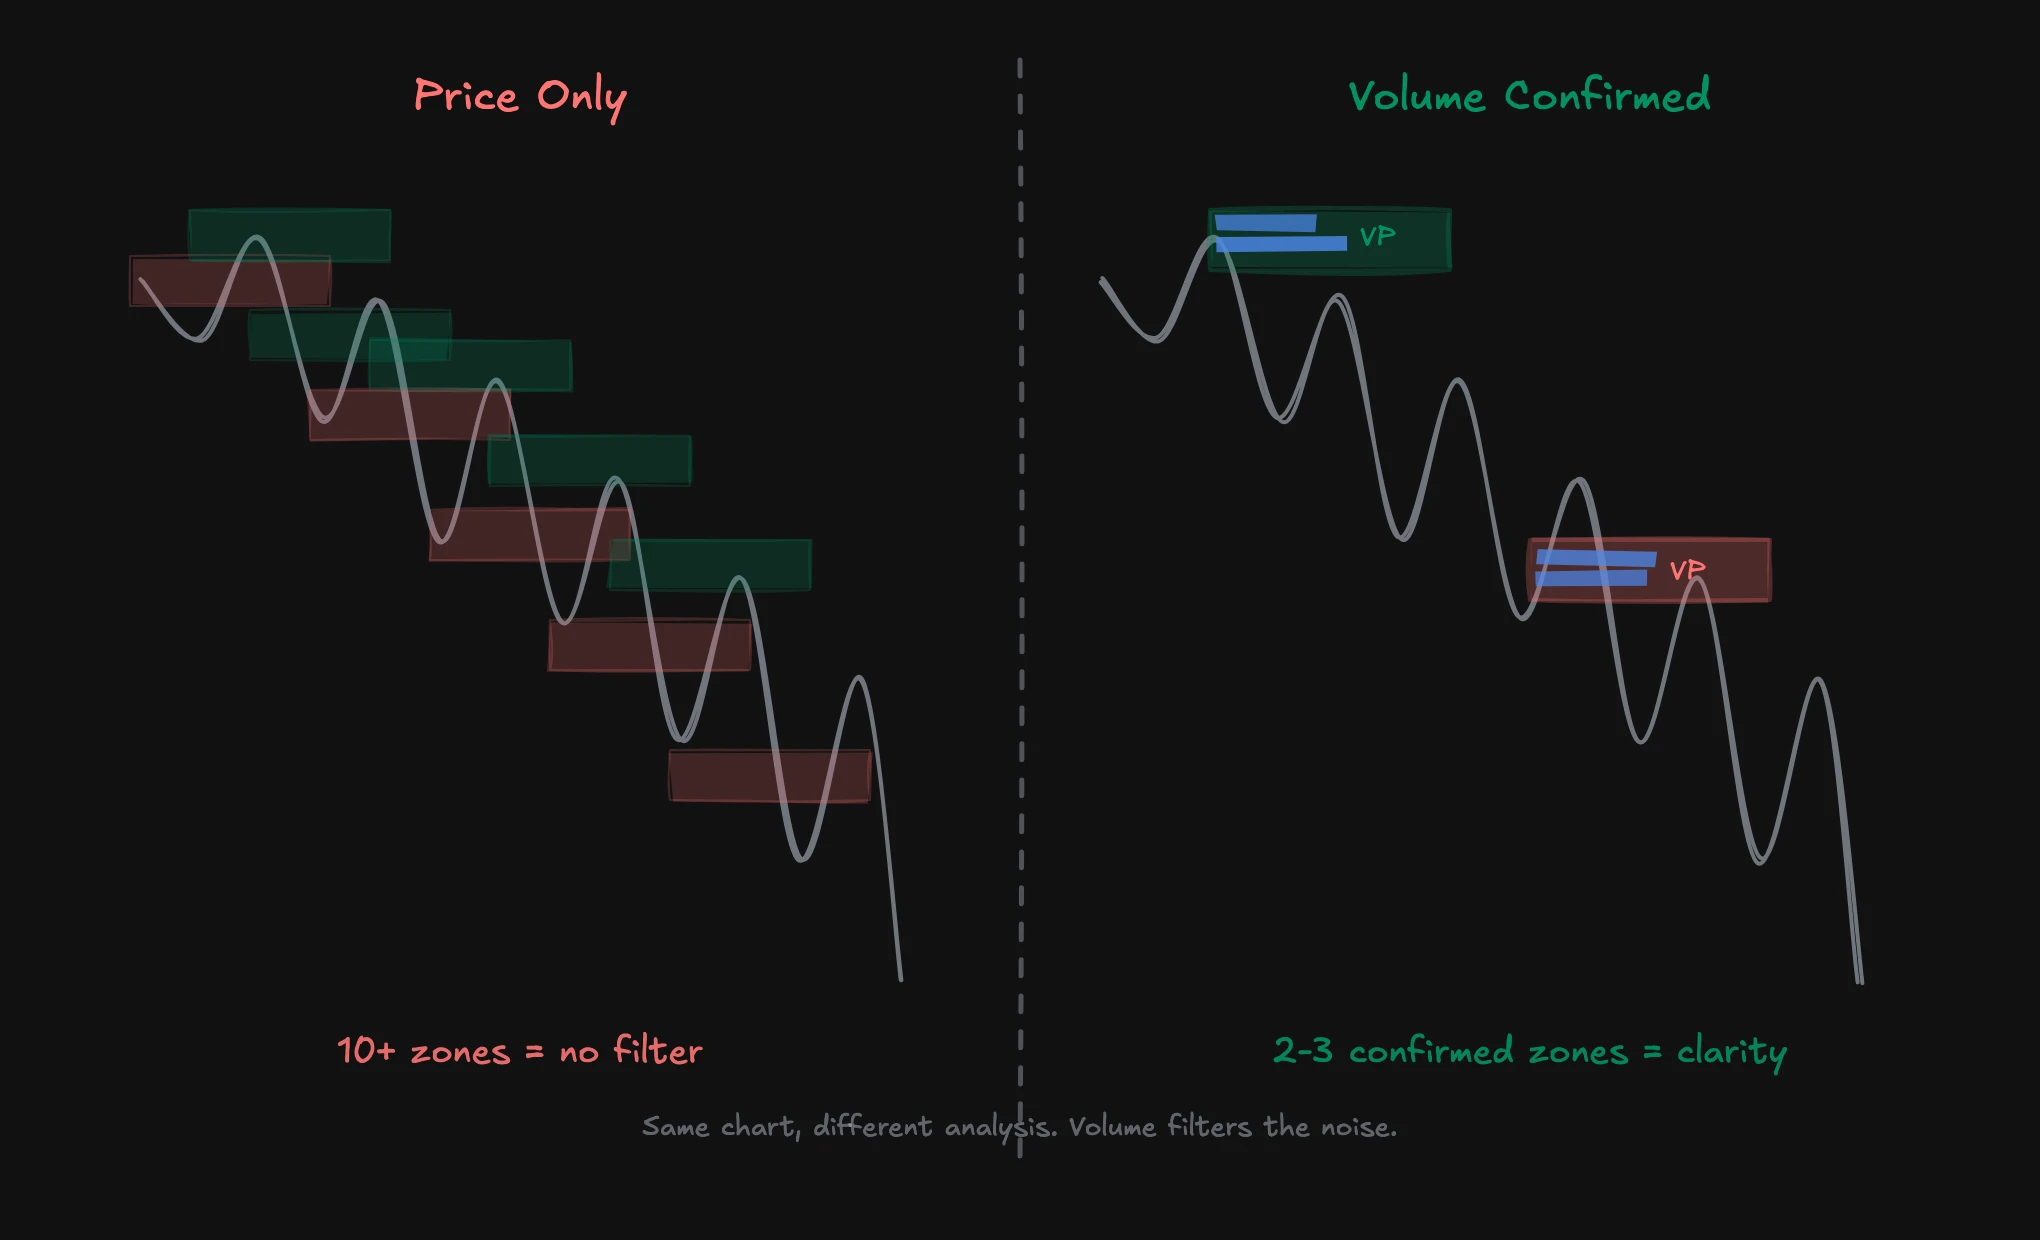
Most supply and demand content online relies exclusively on price. Find a strong move, mark the base as a zone, wait for the retest. It sounds logical, but it performs far worse in practice than promised. Why? Because every chart contains dozens of reversal points, and without volume you have no objective filter.
Too Many Zones, Too Little Context
Take any 15-minute chart of a trading day in the NQ. You will find 8 to 12 swing points. Each of them could be a supply or demand zone under the price-only method. But when everything is a zone, nothing is a zone. You need a method to filter down to the two or three genuine zones where institutional activity actually occurred.
I see this constantly with traders who join our mentoring: charts packed with colored boxes marking every conceivable zone. Then they wonder why price runs straight through 80% of them. The answer is simple: most of those zones were not real supply and demand areas. They were random swing points without institutional substance.
The SMC Problem
Smart Money Concepts (SMC) calls the same idea "Order Blocks." The terminology is different, but the core principle is identical: find areas where "Smart Money" traded. SMC shares the same weakness as classic supply-and-demand trading: it relies almost entirely on price structure. If a bearish candle body sits before a strong sell-off, that is a "Bearish Order Block." The issue: not every bearish candle body before a move contains institutional accumulation.
Neither SMC nor classic supply-and-demand trading is fundamentally wrong. They describe real phenomena. But without volume confirmation, they remain subjective. Two traders can look at the same chart and mark completely different zones, and neither can objectively prove why their zones are better.
Volume Confirmation: The Objective Filter
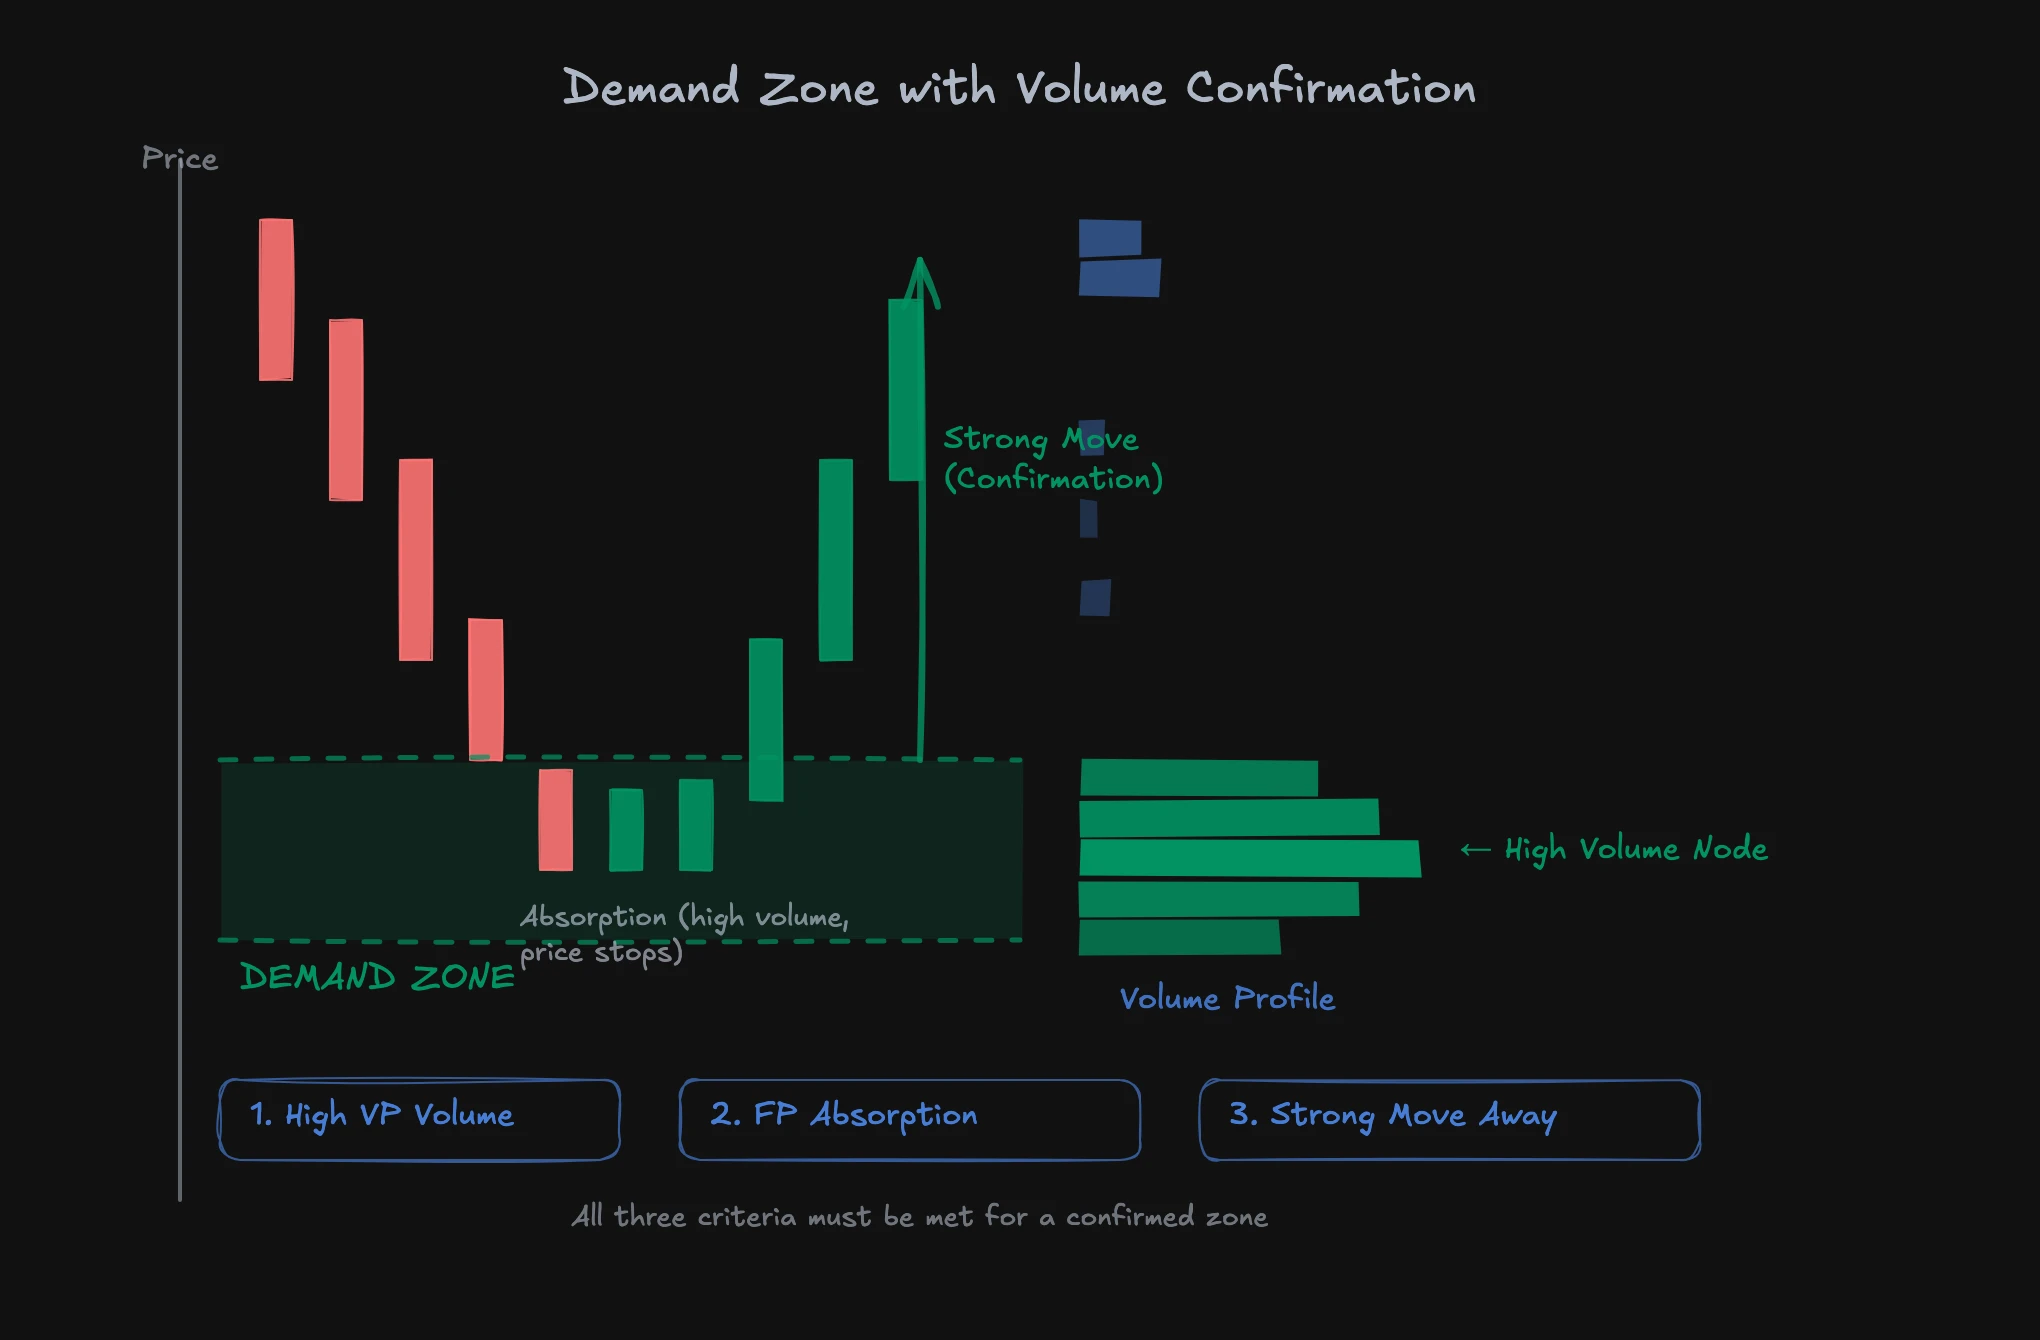
What separates a real supply or demand zone from a random swing point? Volume. Three criteria must align for a zone to qualify as institutionally confirmed: high volume on the Volume Profile, absorption on the Footprint Chart, and a strong move away from the zone.
Criterion 1: High Volume on the Volume Profile
The Volume Profile shows you where trading actually occurred. A High Volume Node (HVN) at a reversal area means buyers and sellers traded intensively there. That is not a random pivot. That is a price area where real transactions took place.
In practice, you look for volume bulges at reversal points. If price reversed at 18,500 and the Volume Profile shows a wide bulge there, you have evidence for institutional activity. If price reversed at 18,500 and the Volume Profile shows a valley there, it was likely a fast rejection without sustained positioning.
Criterion 2: Absorption on the Footprint
Absorption occurs when aggressive sellers hit passive buyers (at a demand zone) or aggressive buyers hit passive sellers (at a supply zone). On the Footprint Chart, you see this as high volume on the bid side with simultaneously negative or neutral delta, even though price stops falling.
Absorption is the moment when smart money builds positions. Aggressive sellers push price down, but passive limit buyers absorb the pressure. Price stops declining even though volume remains high. That is the footprint signal for a genuine demand zone.
Criterion 3: Strong Move Away from the Zone
When institutional positions have been built at a zone, an imbalance forms. Once the aggressive side is exhausted, price moves forcefully in the direction of the dominant side. A strong move away from a demand zone (upward) or supply zone (downward) confirms that the zone had institutional substance.
Without this move, the confirmation is incomplete. An area with high volume and absorption but no follow-through is not a clear signal. Only the combination of all three criteria makes a zone tradeable.
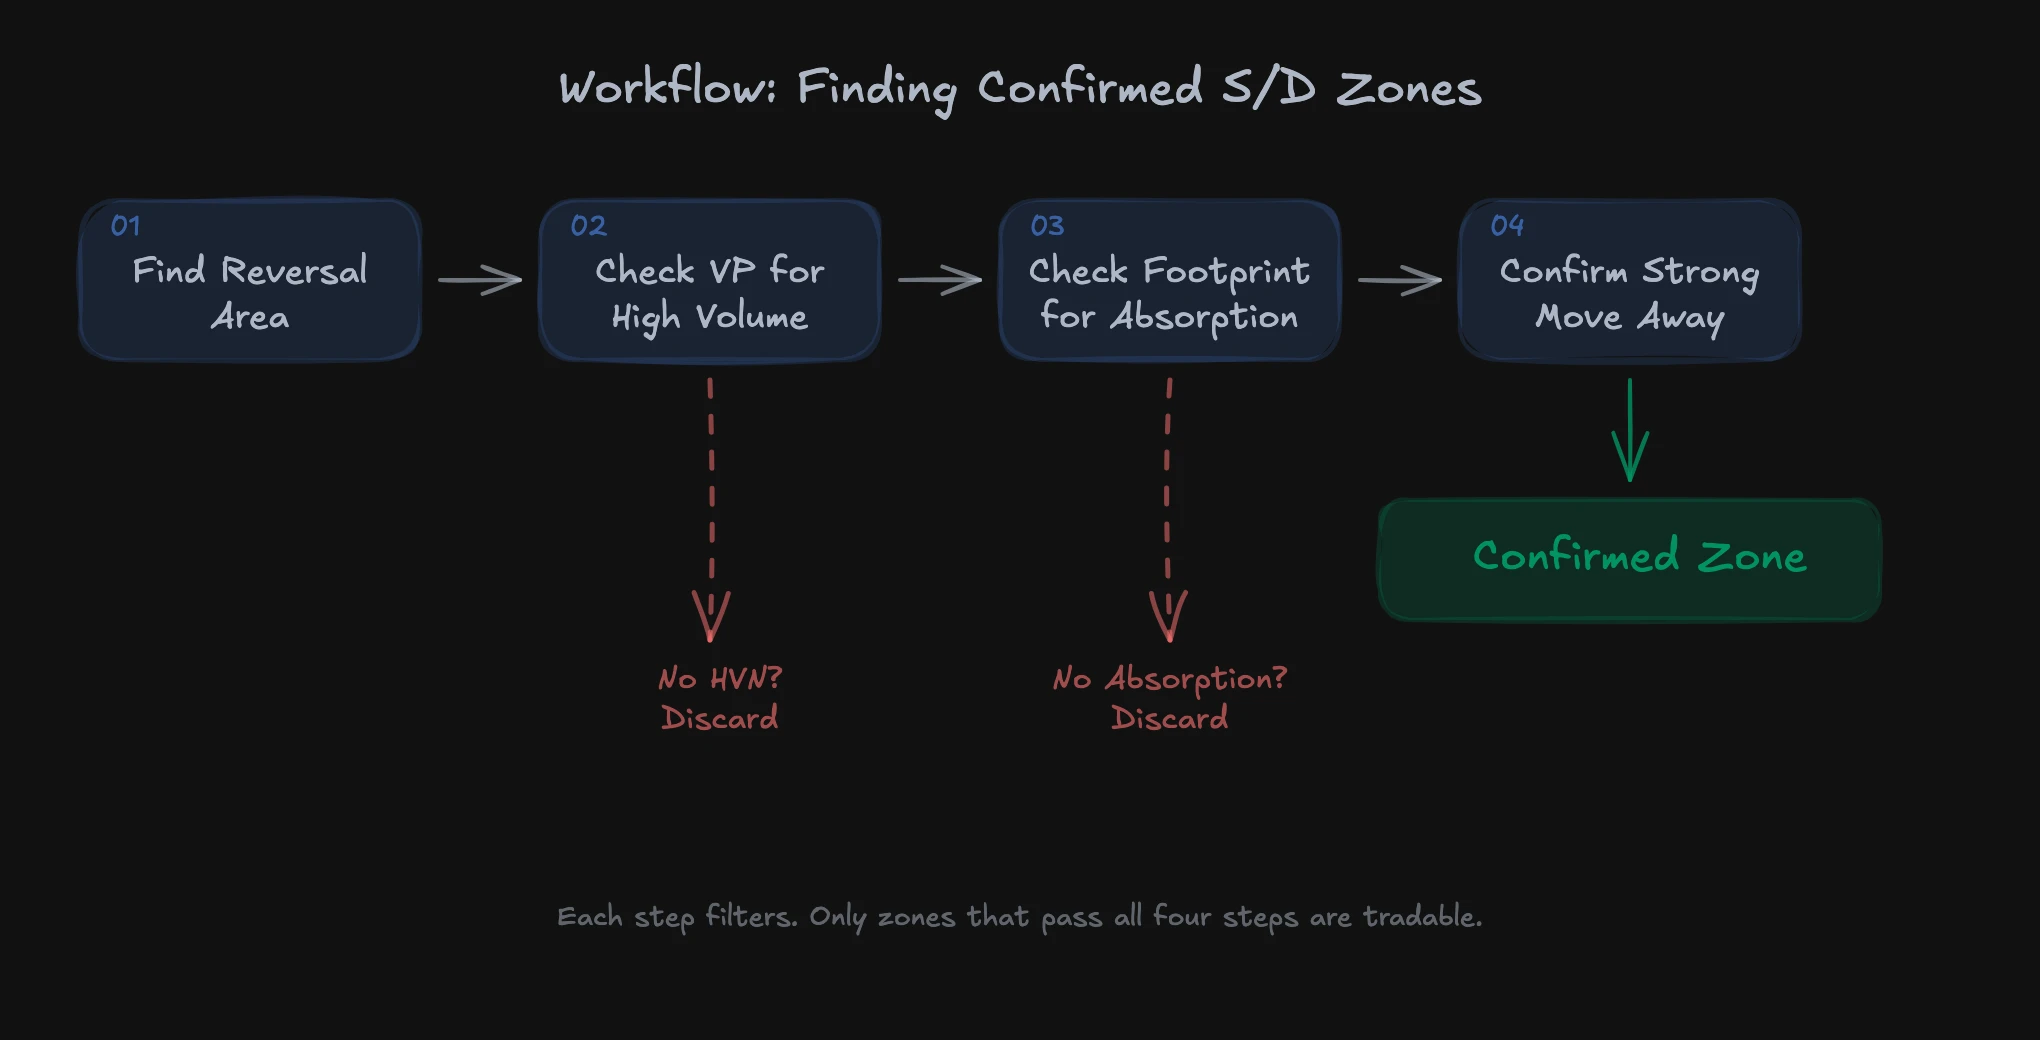
How to Find Confirmed Supply and Demand Zones
The identification process follows a clear workflow. You work from macro structure to micro confirmation, from higher-timeframe context to the specific entry. This is not gambling. This is systematic analysis.
Step 1: Determine the Market Phase
Before searching for zones, you need to know which market phase you are in. In a trending market, demand zones in uptrends and supply zones in downtrends are relevant. In a range, both sides matter depending on where price sits within the range.
The market phase determines which zones you even pay attention to. Hunting for supply zones to short in a strong uptrend is like standing in front of a freight train. Your demand zones for long entries on pullbacks are the tool of choice.
Step 2: Identify Reversal Areas on the Higher Timeframe
Switch to the 30-minute or 60-minute chart and find the areas where price made significant turns. Not every small swing on the 5-minute chart matters. You are looking for moves that influenced the bigger picture.
Multitimeframe analysis is not optional here. It is necessary. A zone visible only on the 1-minute chart has less institutional substance than a zone that spans multiple timeframes.
Step 3: Check the Volume Profile
Overlay the Volume Profile on the identified area. Does it show a High Volume Node? Then you passed the first filter. Institutions traded there. Does it show a Low Volume Node? Then price moved through quickly without building significant positions.
Step 4: Analyze the Footprint
Zoom into the footprint of the reversal area. If you are looking for a demand zone, you want to see absorption: high volume on the bid side, negative or flat delta progression, but price stopping or reversing. That is the fingerprint of passive buyers absorbing selling pressure.
For a supply zone, look for the opposite: high volume on the ask side, positive or flat delta progression, but price no longer advancing. Passive sellers are absorbing buying pressure.
Step 5: Evaluate the Move Quality
How strong was the move away from the zone? An impulsive move with few pullbacks and rising volume confirms the zone. A slow, hesitant move with heavy overlap weakens it. The quality of the move is proportional to the strength of the zone.
Why Supply and Demand Zones Work on Retests
Confirmed supply and demand zones are not just historical markers. They have predictive power because the institutional positions built there carry consequences for the future.
Trapped Participants
At a demand zone with high volume, 50% of participants were long and 50% were short. If price rallied, the shorts lost. When price later returns to that zone, those still holding short positions need to cover, creating additional buying pressure. At the same time, new buyers see the zone as an attractive entry level.
This mechanism explains why genuine demand zones often hold on retests. It is not coincidence and not a self-fulfilling prophecy. It is market mechanics: trapped positions generate predictable pressure.
Fresh vs. Retested Zones
A "fresh" zone that has never been tested tends to be stronger than one that has already been tested multiple times. Each retest resolves some of the trapped positions. The zone loses substance. After two or three retests, most of the original positions have been closed, and the zone offers little remaining support or resistance.
In practice: the first retest of a confirmed zone is the strongest. From the second or third retest onward, the probability of a successful reaction declines. This is particularly relevant for stop runs, where price pokes just through a zone to trigger remaining stops before reversing.
The Role of OPEX
Options expiration (OPEX) can amplify or neutralize supply and demand zones. When large options positions sit at certain strikes, they create additional liquidity concentration. A strike price with high open interest functions similarly to a supply or demand zone because market makers need to adjust their hedges at those prices.
Price-Only vs. Volume-Confirmed: The Comparison
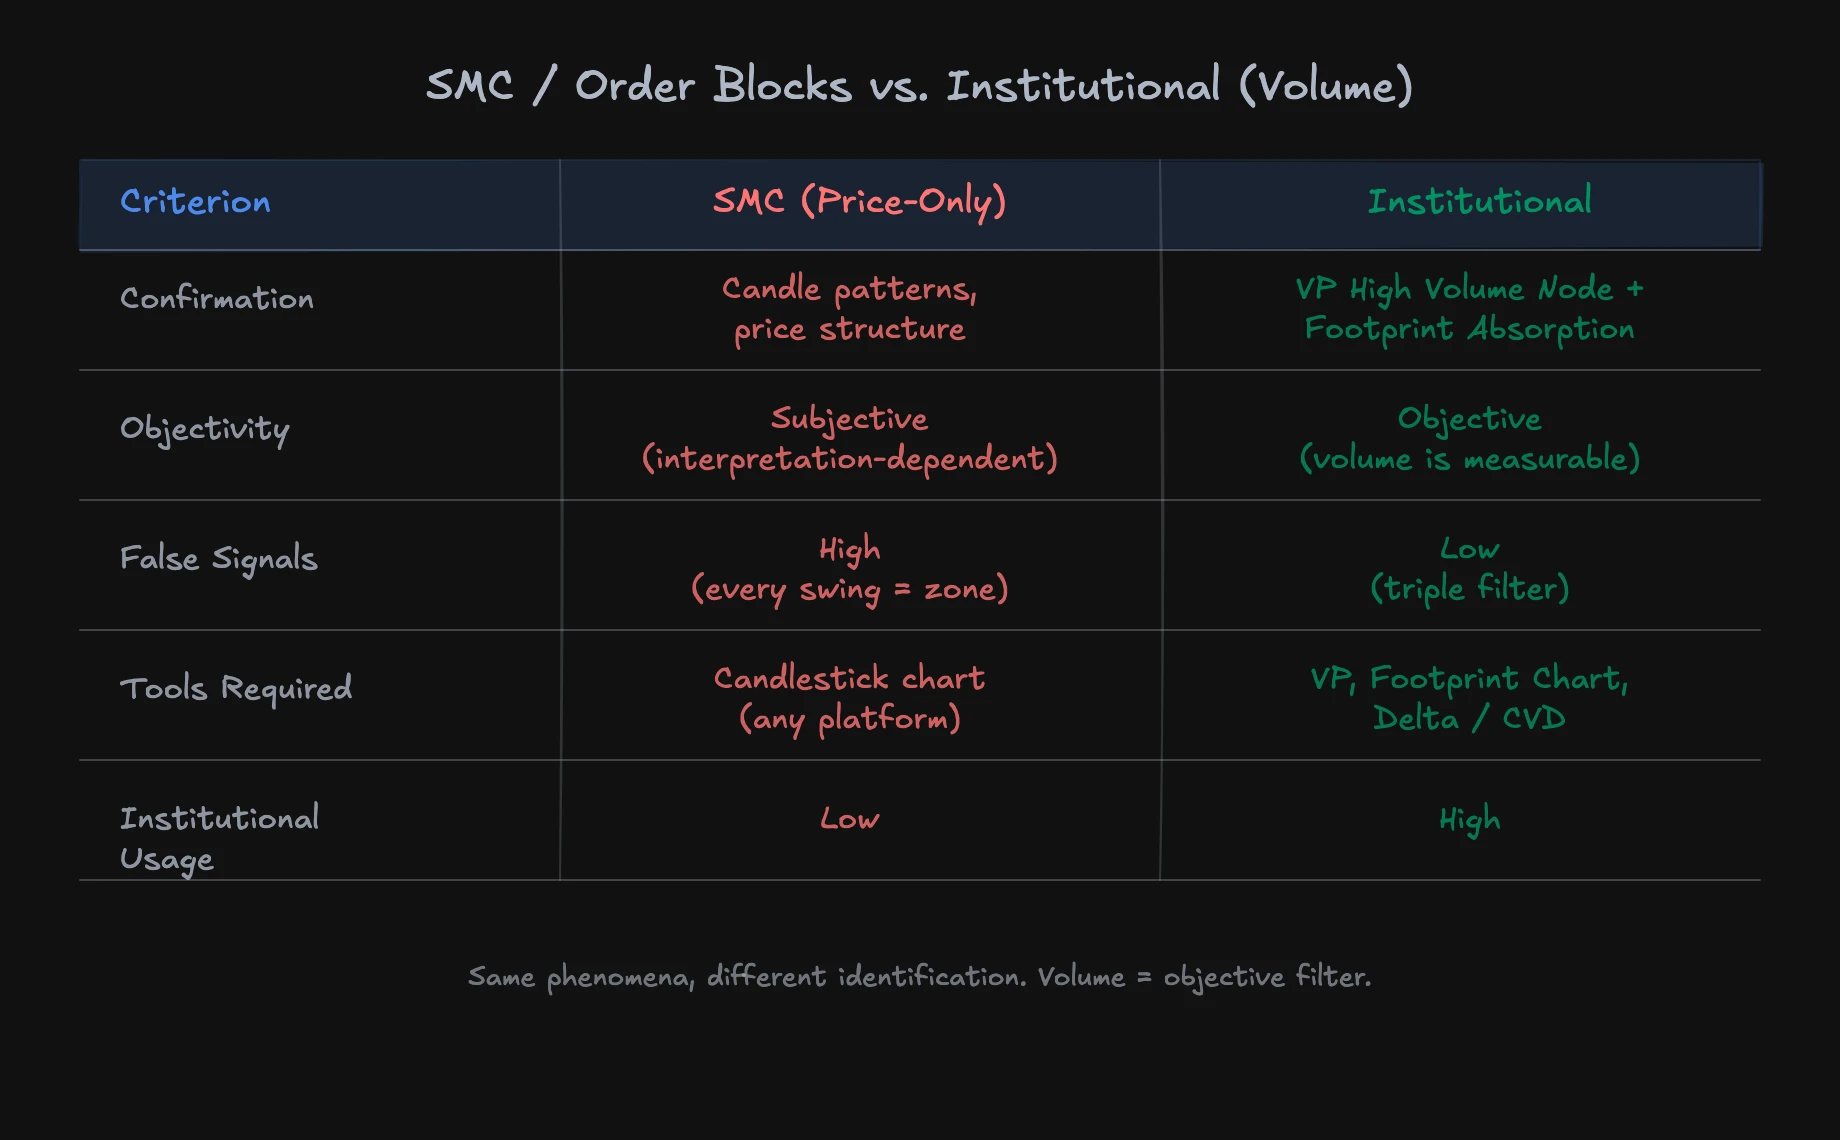
The following table shows the fundamental difference between price-only approaches (classic supply/demand, SMC/Order Blocks) and the volume-confirmed approach.
| Criterion | Price-Only (SMC/S&D) | Volume-Confirmed |
|---|---|---|
| Confirmation method | Price structure, candle patterns | VP High Volume Node + Footprint absorption |
| Objectivity | Subjective (two traders, two results) | Objective (volume is measurable) |
| False positives | High (every swing = potential zone) | Low (triple filter) |
| Tools needed | Candlestick chart | Volume Profile, Footprint Chart, Delta/CVD |
| Learning curve | Shallow (quick to learn) | Steep (requires order flow understanding) |
| Institutional usage | Low | High |
Neither approach is inherently wrong. If you trade price-only zones, you will correctly identify some of them simply because price and volume correlate. But your hit rate will be lower because you lack an objective filter. Volume gives you that filter.
Bridging SMC and Institutional Trading
SMC concepts like Order Blocks, Breaker Blocks, and Mitigation Blocks describe real phenomena. A "Bullish Order Block" is nothing other than a demand zone where institutional accumulation occurred. The issue is not the description but the identification. SMC identifies these areas through price patterns. Institutional traders identify them through volume.
If you come from the SMC world, you do not need to discard your concepts. You need to back them with volume. A Bullish Order Block with a High Volume Node on the VP and visible absorption on the footprint carries a significantly higher probability than an Order Block based solely on candle structure.
Practical Application: Supply and Demand Zones in the NQ
The following principles apply to any liquid futures market, but I demonstrate them on the Nasdaq-100 Futures (NQ) because it is the instrument I have traded for years and the primary instrument in our mentoring program.
Finding Demand Zones in Uptrends
In an established uptrend, look for pullback areas where price temporarily declined before the trend continued. Check these areas against the three criteria:
- Volume Profile: Does the pullback area show a High Volume Node? If so, accumulation occurred there.
- Footprint: Do you see absorption on the bid side? Passive buyers absorbed selling pressure.
- Move: How strong was the subsequent rally? An impulsive move confirms the zone.
When all three criteria are met, you have a confirmed demand zone for the next pullback.
Finding Supply Zones in Downtrends
The mirror image: in a downtrend, look for rally areas where price temporarily rose. Check for a High Volume Node, absorption on the ask side, and a strong move downward.
Supply and Demand in Ranges
In a sideways market, both supply and demand zones are relevant. The Value Area High from the Volume Profile often marks a natural supply zone, and the Value Area Low a natural demand zone. Additionally check the footprint at these boundaries: is price being absorbed, or is it breaking through?
Recognizing Invalidation
A supply or demand zone does not remain valid forever. When price breaks through a zone with high volume and closes on the other side, the zone is invalidated. On the footprint, you see this as a lack of absorption: price pushes through without passive orders stopping the move.
The ability to recognize when a zone has been invalidated is just as important as finding zones in the first place. Many traders cling to zones that have long been broken, producing avoidable losses.
Supply and Demand in the Broader Market Context
Supply and demand zones do not exist in isolation. They interact with other market structures, and understanding these interactions separates a good setup from an exceptional one.
Interaction with the VWAP
The VWAP (Volume Weighted Average Price) shows the average transaction price of the day. When a confirmed demand zone sits near the VWAP, both signals reinforce each other. Institutions benchmarked against the VWAP have additional incentive to buy at that level.
Confluence with Prior Day Levels
The prior day settlement, prior day highs and lows, the prior day Value Area: when a confirmed supply or demand zone aligns with one of these levels, the probability of a reaction increases. Not because the levels are magic, but because multiple groups of market participants react at the same price.
The Time Component
Fresh zones (within the current session) are stronger than old zones (multiple days old). The more time passes, the more of the original positions have been closed. Institutional traders think in sessions. A zone from three days ago has a different relevance than a zone from 30 minutes ago.
FAQ: Common Questions About Supply and Demand Zones
What is the difference between supply/demand zones and support/resistance?
Support and resistance describe price levels where price has historically reversed. Supply and demand zones explain why price reverses there: because institutional buy or sell orders are concentrated at those prices. Support/resistance is descriptive; supply/demand is causal. In practice, they often overlap, but a supply or demand zone with volume confirmation gives you more confidence than a pure support or resistance level.
Do supply and demand zones work in all markets?
The principle works in any liquid market where real transactions occur. Futures, high-volume stocks, forex majors: anywhere institutional participants are active. In illiquid markets (penny stocks, exotic cryptocurrencies), the institutional substance that gives supply and demand zones their predictive power is missing.
How many zones should I have on my chart at any given time?
Less is more. If you have more than three to four active zones on your chart, you probably have not filtered strictly enough. Per direction, you should have one to two confirmed zones in the current context at most. Anything beyond that dilutes your analysis and creates decision paralysis.
Can I find supply and demand zones without order flow software?
You can find approximations. A standard Volume Profile available in most charting platforms will show you High Volume Nodes and Low Volume Nodes. That covers the first filter. For full confirmation (absorption on the footprint, delta analysis), you need specialized order flow software. But even a basic Volume Profile will significantly improve your zone identification compared to the pure price-only approach.
How should I react when price breaks through my zone?
Accept the invalidation. A broken zone is no longer a zone. On the footprint, you recognize the break as aggressive volume running through the area without meeting passive absorption. If you are in a trade and your zone breaks, that is your signal to exit, not to add to the position.
In our mentoring program, you learn these concepts across 1,500+ video lessons with real chart examples. At uniteddaytraders.com, you'll find the complete course with 14 dedicated lessons on liquidity and institutional accumulation alone.